policy
Policy Gaps
Dawar H. Butt, Sunil Dahiya ·
← Unveiling Pakistan's Air Pollution
A retreat on public health: Pakistan’s 2023 National Clean Air Policy proposes weaker air quality targets than the country’s own standards from 2010, moving further away from, not closer to, WHO health guidelines.
Policies without teeth: Key national and provincial policies lack legally binding emission reduction targets for specific sectors or cities, making it impossible to measure progress or enforce accountability.
Flying blind: A critical lack of a comprehensive, nationwide air quality monitoring network means that policymakers are often creating plans without the foundational data needed to target the right sources or measure success.
This chapter has been adapted from the Center for Research on Energy and Clean Air (CREA) report “Air Quality Governance in Pakistan” by Dawar H. Butt and Sunil Dahiya, with additional contributions received from Chengcheng Qiu in China and Manoj Kumar in India.
The path to clean air is not a mystery; it has been charted by others. While cities from Beijing to London have proven that a transition from hazardous pollution to blue skies is possible, Pakistan’s policies have yet to deliver meaningful results. This chapter provides a crucial benchmark, measuring our national and provincial strategies against the successful governance frameworks of China and India. It is an unflinching look at the gaps in our standards, monitoring, and enforcement, providing a clear, evidence-based roadmap for building a system that doesn’t just create policies, but achieves clean air.
Air pollution is a persistent global challenge, and Pakistan is acutely affected. While cities like London, Los Angeles, and Beijing have navigated periods of extreme air pollution and demonstrated pathways towards cleaner air, many cities across South Asia, including those in Pakistan, continue to grapple with hazardous pollution levels, often showing limited progress in mitigation.
The scale of Pakistan’s crisis is stark. The 2023 World Air Quality Report ranked Pakistan as the second most polluted country globally based on annual average PM2.5 concentrations, with major cities like Lahore and Peshawar frequently listed among the world’s top 10 most polluted urban areas.1 The health consequences are devastating; the Health Effects Institute’s State of Global Air 2024 report attributes up to 256,000 premature deaths annually in Pakistan directly to poor air quality.2
Although comprehensive air quality data and research within Pakistan remain limited compared to the scale of the problem, available information consistently reveals hazardous pollution levels across various parts of the country. The issue garnered significant media and public attention around 2017, following prolonged episodes of thick “smog” blanketing Lahore, the capital of Punjab province. Responding to the escalating crisis and public outcry, both the Lahore High Court and the Supreme Court of Pakistan issued directives between 2016 and 2018, compelling the Punjab provincial government to devise policies aimed at mitigating the worsening air quality. While most subsequent government actions have remained concentrated on Lahore, recent years have seen growing awareness of the need to monitor, understand, and regulate rising air pollution levels in other cities and provinces, and indeed, at the national level.
A legacy of legislation, a history of delay
Pakistan’s legislative journey on environmental protection has often mirrored international developments. Following the landmark 1972 Stockholm Declaration on the Human Environment, Pakistan established the Ministry of Environment in 1975.3 The foundational Pakistan Environmental Protection Ordinance (PEPO) was promulgated in 1983, creating key institutions like the Environment Protection Agency (Pak-EPA) and the Environment Protection Council (EPC) at the federal level, with provincial EPAs established subsequently.4
The Pakistan Environmental Protection Act (PEPA) of 1997 superseded the 1983 ordinance and remains the principal environmental law governing federal and provincial actions today. PEPA 1997 paved the way for various implementing rules and regulations, including those establishing environmental tribunals (1999),6 procedures for sample collection (2001),7 requirements for industrial self-monitoring (2001),8 and environmental impact assessment (EIA) processes (2000).
National Environment Quality Standards (NEOS) were first introduced in 1993, subsequently revised in 1999, and later expanded in 2009 to include standards for motor vehicle emissions.9 A National Environment Policy was approved in 2005, explicitly recognising the problem of worsening urban air quality. In 2010, crucial NEQS for ambient air were approved, setting legally binding annual and daily limit values for various key pollutants,
including particulate matter.
A significant constitutional shift occurred with the 18th Amendment in 2010, which devolved the subject of environmental protection and pollution control primarily to the provinces. Following this devolution, each province enacted its own environmental protection acts, largely based on the federal PEPA 1997 framework. Provinces also adopted the national standards (NEQS) as their provincial standards, although Sindh province notably relaxed its ambient air quality limits in 2016 compared to the national standards.10 Since 2017, responding to court orders and the visible crisis of smog, the Punjab government has issued several policies related to air quality, culminating in the Punjab Clean Air Action Policy11 and a Smog Mitigation Plan announced in 2023 and early 2024.12
Policies on paper: a critical assessment
In March 2023, Pakistan approved the National Clean Air Policy (NCAP),13 representing the first federal-level policy attempt to systematically address the worsening air pollution situation since a previous plan from 2009 failed14 to be implemented. The NCAP targets five key sectors, proposing one major intervention in each: enhancing transport fuel quality standards (to Euro-V and Euro-VI); enforcing emission standards for industry; preventing agricultural residue burning in agriculture; preventing open burning of municipal solid waste; and promoting low-emission cooking technologies for households. The policy projects a 21% reduction in PM2.5 emissions by 2030 compared to 2020 levels, increasing to a 70% reduction by 2040.15
While the NCAP takes some positive steps, a critical analysis reveals significant shortcomings alongside its strengths. On the positive side, the policy highlights the need to revise existing industrial emission standards and establish sector-specific limits, restricts new industrial development within city boundaries, promotes decarbonisation of the power sector, prioritises establishing emission inventories with annual updates, and mandates periodic reviews of the policy and its implementation plan.
However, several critical gaps undermine its potential effectiveness. Most concerningly, the NCAP proposes ambient air quality targets that represent a retreat from previously established, stricter standards. Instead of aligning with the WHO’s updated 2021 air quality guidelines16 17 or maintaining the stricter NEQS 2010 limits (which were intended to be fully implemented by 2013), the NCAP adopts the WHO’s older, less protective interim targets, effectively increasing allowable PM2.5 levels by potentially more than 50% compared to
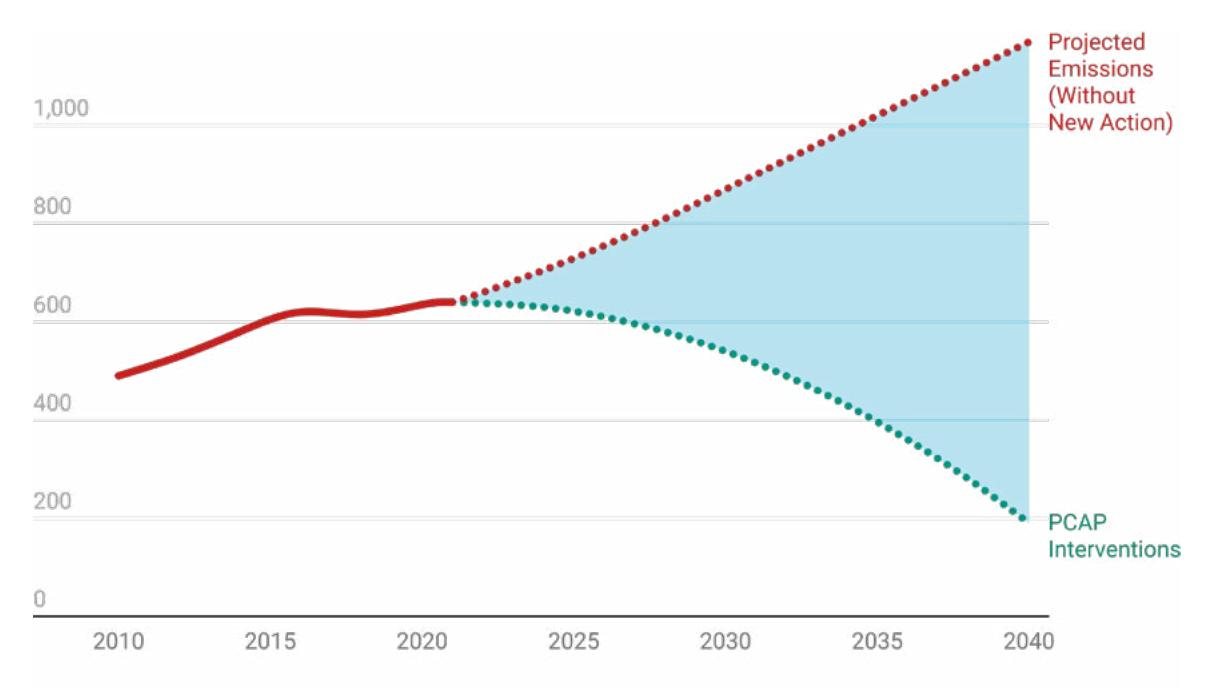
Exhibit 15.1: The Policy Gap Visualised. The shaded area represents the vast gulf between two possible futures: the escalating crisis of unchecked emissions, and the cleaner air promised by the National Clean Air Policy. This is the ‘policy gap’ made visible. Closing it—and turning the promise of the green line into reality—depends entirely on overcoming the failures in standards, monitoring, and enforcement that have historically kept such plans on paper.
the 2010 NEQS.18 Furthermore, the policy lacks specific emission load reduction targets for key polluting sectors, major cities, or provinces, making progress difficult to measure and enforce. It also largely ignores the issue of transboundary air pollution and fails to propose mechanisms for airshed-level management, which is crucial in the South Asian context. The NCAP provides insufficient direction to provincial EPAs on developing detailed regional and city-level clean air action plans based on local data. Crucially, the policy lacks legal backing; it serves as an advisory document without clear enforcement mechanisms or penalties for non-compliance.
The Punjab Clean Air Policy (PbCAP), approved in April 2023 shortly after the NCAP, sets provincial targets of achieving 30% reductions in particulate matter and 25% reductions in gaseous pollutants by 2030.19 20 It outlines short-term (2024), medium-term (2026), and long-term (2030) sectoral milestones. While more specific than the NCAP, both policies suffer from a significant limitation: the apparent lack of comprehensive, up-todate emission inventories underpinning the target-setting process.21 Although the NCAP mentions developing a national inventory and a provincial inventory for Punjab (covering 1990-2020) was published after the PbCAP’s adoption, it remains unclear whether this
| Time-period | NEQS 2010 | NEQS 2013 | WHO 2021 | NCAP 2023 |
|---|---|---|---|---|
| 24-hours | 40 | 35 | 15 | 75 |
| Annual | 25 | 15 | 5 | 35 |
NCAP Proposed WHO, 2021 interim guideline
Exhibit 15.2: The Governance Gap in PM2.5 Standards. This table compares Pakistan’s past and proposed national air quality standards (NEQS and NCAP) for PM2.5 against the World Health Organization’s (WHO) 2021 healthbased guidelines. It reveals a significant governance gap: the proposed national standard for annual exposure (35 µg/m³) is seven times weaker than the level WHO advises for protecting public health (5 µg/m³). By proposing to adopt the WHO’s most lenient interim target instead of the guideline itself, the policy risks locking in a level of air pollution that is officially recognised as dangerous to human health.
detailed data truly informed the reduction targets specified in the policies.22 Moreover, these and later inventories may not fully account for secondary particulate formation, a major component of PM2.5 pollution.1
The effective implementation and monitoring of these policies are further undermined by the inadequacy of air quality monitoring networks. While Punjab has made some progress under the World Bank-supported Green Development Programme from 2018, aiming to operationalise 30 monitoring stations by 2024 (not fully deployed at time of publication), the NCAP lacks clear objectives for establishing a robust national monitoring network. Monitoring capacity remains virtually non-existent in Balochistan, Khyber Pakhtunkhwa, and Sindh, creating significant data gaps across large parts of the country.
The path to blue skies: lessons from China and India
Examining the air quality management journeys of other countries facing similar challenges, particularly China and India, offers valuable insights for Pakistan.
China: a 10-Year journey from grey to blue skies
China’s remarkable transition over the past decade provides key lessons. After initially establishing air quality standards in 1982 (revised significantly in 2012), China launched comprehensive air pollution control policies between 2013 and 2017, followed by a second phase from 2018 to 2020. Their current policies include ambitious targets for reducing PM2.5, NOx, and VOCs by 2025.
Key elements underpinning China’s success include: building a comprehensive national monitoring network (expanding from 74 cities in 2013 to 338 cities and 1,436 stations by 2015, supported by substantial investment); adopting a regional airshed management approach with coordinated efforts at multiple governance levels and special focus on heavily polluted regions; establishing stringent, sector-specific emission standards, including ultra-low emissions policies for power plants (2014), steel (2019), and cement
| Targeted Reductions | Policy | Reduction Target (1%) | Baseline Year |
|---|---|---|---|
| PM2.5 | NCAP | 38% vs BAU, 21% vs 2020 | Baseline / 2020 |
| PbCAP | 30% | 2022 | |
| NOx | NCAP | No target Specified | |
| PbCAP | 25% | 2021 | |
| SO2 | NCAP | No target Specified | |
| PbCAP | 25% | 2021 | |
| Ozone | NCAP | No target Specified | |
| PbCAP | 25% | 2021 | |
| CO | NCAP | No target Specified | |
| PbCAP | 25% | 2021 |
Exhibit 15.3: Gaps in Ambition: Comparing National and Punjab Clean Air Targets. This table compares the pollution reduction targets of the National Clean Air Policy (NCAP) and the Punjab Clean Air Plan (PbCAP). It reveals two critical governance gaps: first, the national policy only sets a target for a single pollutant (PM2.5), leaving four other major pollutants unregulated at the federal level. Second, the two policies use different baseline years, making a direct comparison of their ambition challenging and highlighting a lack of a unified, nationwide strategy for air quality management.
industries (2024); implementing a strong accountability system featuring remote quality control, severe penalties for data tampering, and public availability of hourly monitoring data; and demonstrating high-level political commitment and enforcement, including significant penalties for manipulating air quality data following President Xi Jinping’s 2015 pledge.
India: policymaking for unique South Asian challenges
India shares many geographical and pollution source challenges with Pakistan, particularly across the Indo-Gangetic Plain. India’s air quality management efforts began with monitoring in ten cities in 1978, expanding into a National Ambient Air Quality Monitoring programme by 1984-1985. Ambient air quality standards were established in 1982 and revised in 1994 and 2009.
India’s evolving approach incorporates several key features: an extensive monitoring network, which grew from seven stations in 1984 to 549 continuous monitoring stations and over 1,000 manual stations by 2024; a gradual shift towards airshed-based planning, moving beyond purely administrative boundaries, exemplified early on by the Taj Trapezium Eco-Sensitive Zone established in the 1980s; the implementation of crisis response mechanisms, such as the Graded Response Action Plan (GRAP) initiated in 2017 for managing hazardous air quality episodes in the National Capital Region; the establishment of dedicated accountability structures, like the Commission for Air Quality Management for the National Capital Region (CAQM) formed in 2020-2021; and setting targeted reduction goals through initiatives like the National Clean Air Programme (NCAP), launched in 2019, which specifies PM2.5 and PM₁₀ reduction targets for major non-attainment cities.
| AQI | PM 2.5 | US-EPA Health-based AQI | Punjab 2017 AQI | Punjab 2021 AQI |
|---|---|---|---|---|
| 0-50 | 0-9.0 | Good | Good | Good (0-50 AQI, 0-15 PM2.5) |
| 51-100 | 9.1-35.4 | Moderate | 0-100 AQI, 0-35 PM2.5 | Satisfactory (51-100, 16-35) |
| 101-150 | 35.5-55.4 | Unhealthy* | Satisfactory | Moderate (101-150 , 36-70) |
| 151-200 | 55.5-125.4 | Unhealthy | 101-200 AQI, 36-70 PM2.5 | Unhealthy* (151-200, 71-150) |
| 201-300 | 125.5-225.4 | Very Unhealthy | Moderate 201-300 AQI, 71-105 PM2.5 | Unhealthy 201-300 AQI, 151-250 PM2.5 |
| 301-500 | 225.5-325.4 | Hazardous | Poor 301-400 AQI, 106-140 PM2.5 | Very Unhealthy 301-400 AQI, 251-350 PM2.5 |
| Very Poor 401-500 AQI, 141-300 PM2.5 | Hazardous 401-500 AQI, > 350.1 PM2.5 | |||
| > 500 | > 325.4 | Beyond Index | Severe > 500 AQI, > 300 PM2.5 |
Exhibit 15.5. The Governance Gap in Air Quality Communication. This unified table compares Punjab’s 2017 and 2021 air quality standards against the health-based US-EPA benchmark. Anchored by consistent PM2.5 pollution levels (left column), the table reveals how local policies have used different health categories and numerical breakpoints to describe the same air. The discrepancy is most stark under the 2017 policy, where air pollution classified as ‘Unhealthy’ was officially communicated to the public as ‘Satisfactory,’ dangerously misleading citizens about the true threat to their health.
A blueprint for effective governance
Drawing lessons from these international best practices and analysing the gaps in Pakistan’s current framework, strengthening the nation’s air quality governance requires focusing on several key areas:
- Enhanced monitoring: Significantly expand the air quality monitoring network across both urban and rural areas to accurately understand pollution sources, track trends, assess policy effectiveness, and direct targeted interventions.
- Tighter standards: Strengthen Pakistan’s ambient air quality guidelines progressively, aligning them with the WHO’s 2021 recommendations over a defined timeline, rather than relaxing existing standards or adopting outdated interim targets.
- Emission load reduction targets: Move beyond ambient concentration targets alone and establish legally binding, time-bound emission load reduction targets for key pollutants (PM2.5, SOT , NOx, VOCs) across major polluting sectors, large cities, and provinces.
- Airshed-based planning: Adopt a scientifically determined airshed management approach, developing comprehensive, coordinated clean air action plans at regional (airshed), provincial, and national levels that address pollution sources holistically, including transboundary contributions.
- Costed transition plans: Develop detailed, costed transition plans for key pollutioncontributing sectors (e.g., industry, transport, power, agriculture, waste management) that outline specific mitigation measures, required investments, and funding sources, integrated into annual planning and budgeting cycles.
| Year | Policy / Legislation |
|---|---|
| Federal | |
| 1983 | Pakistan Environmental Protection Ordinance |
| 1997 | Pakistan Environmental Protection Act |
| 2001 | National Environmental Action Plan |
| 2005 | National Environmental Policy |
| 2010 | National Environment Quality Standards (Ambient Air) |
| 2023 | National Clean Air Policy (NCAP) |
| Provincial | |
| 2012 | Punjab Environmental Protection Act |
| 2012 | Baluchistan Environmental Protection Act |
| 2014 | Khyber Pakhtunkhwa Environmental Protection Act |
| 2014 | Sindh Environmental Protection Act |
| Punjab | |
| 2017 | Policy on Controlling Smog |
| 2018 | Punjab Clean Air Action Plan |
| 2018 | Standing Instructions for Managing Poor Air Quality |
| 2022 | Health Advisory System for Critical Air Pollution Events |
| 2023 | Punjab Clean Air Policy (PbCAP) |
| 2023 | Punjab Smog Prevention and Control Rules |
| 2024 | Smog Mitigation Plan |
Exhibit 15.5. Timeline of Environmental Legislation. This table chronicles over four decades of key federal and provincial policies, acts, and rules related to environmental protection in Pakistan. It highlights a significant acceleration in policy-making, particularly in Punjab since 2017, in response to the worsening smog crisis. The persistence of hazardous air quality, despite this legislative activity, points to a critical gap between policy on paper and effective implementation on the ground.
- Evidence-based response protocols: Create data-driven Graded Response Action Plans (GRAPs) or similar protocols for major cities and polluted regions to trigger specific, pre-defined actions (e.g., traffic restrictions, school closures, industrial curtailments) based on monitored or forecasted air quality levels, prioritising public health protection during severe pollution episodes
- Industrial accountability and transparency: Revise and rigorously enforce tighter emission standards for major industrial sectors, incorporating continuous emission monitoring systems (CEMS) requirements for large polluters, and enhance transparency through mandatory public disclosure of emissions data and compliance status.
Implementing these recommendations would significantly strengthen Pakistan’s air quality governance framework, aligning it more closely with successful international approaches and creating a viable pathway towards achieving meaningful and sustained improvements in air quality across the country.
Footnotes
-
Urban Unit. (2023). Emission inventory of Punjab 1990–2020. ↩