Peshawar
PAQI Team ·
← Unveiling Pakistan's Air Pollution
Highest per-capita burden: Peshawar’s unique mix of transit trade, traditional industry, and geography gives it the highest per-capita PM2.5 emissions (2.14 kg/person/year) among Pakistan’s major cities.
A devastating health burden: The city’s annual average PM2.5 was 95.8 µg/m³ in 2024—over 19 times the WHO guideline. Residents experienced zero clean air days all year, which shortens life expectancy by 5.8 years.
Where transit meets tradition: The pollution profile is dominated by transportation (51%), but with major contributions from brick kilns (19%) and small-scale traditional industries (14%).
In the historic gateway to the Subcontinent, the air itself has become a barrier. Peshawar, a city defined by its vibrant trade and deep-rooted traditions, is now trapped in a basin of its own emissions. The very activities that give the city its unique character—the flow of regional commerce and the hum of artisanal industry—have become the primary sources of a severe, and deeply personal, public health crisis. This chapter provides evidence to show that honouring tradition and ensuring a healthy future are not mutually exclusive goals.
Peshawar, the capital of Khyber Pakhtunkhwa, faces a distinct air quality challenge, blending its role as a transport hub with a legacy of traditional, often unregulated, industries. This unique combination, exacerbated by the city’s location in a geographic basin that traps pollutants, results in the highest per-capita pollution levels among Pakistan’s major cities, creating a public health crisis of a grand scale.
An intense and enduring public health crisis
Peshawar’s air quality is severe and continuous. For the 2024 calendar year, the city’s annual average PM2.5 concentration was 95.8 µg/m³. This is over 19 times the WHO safety guideline and more than six times the national standard, cementing Peshawar’s status as a city facing an intense public health threat.
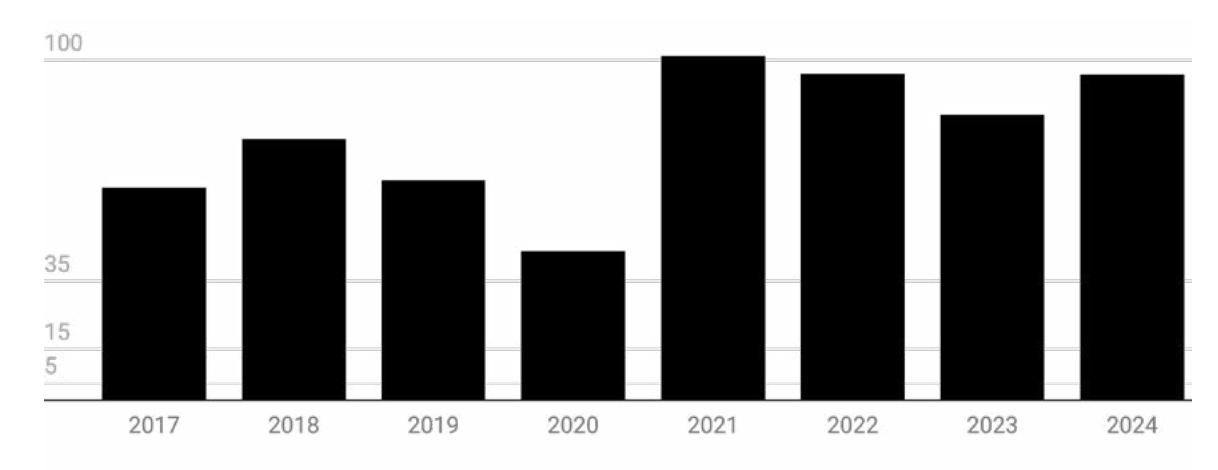
Exhibit 7.1: Peshawar’s Chronic Pollution Problem (Annual Averages 2017-2024). This chart shows Peshawar’s high annual average PM2.5 concentration over the last eight years. The data confirms that the city’s unique mix of transit traffic, traditional industry, and geographical constraints creates some of the most hazardous air quality in the nation.
A valley trapped in winter haze
Peshawar’s location in a basin surrounded by mountains makes it particularly susceptible to winter pollution episodes. During the winter of 2023-2024, pollution levels surged to be 4.1 times higher than the subsequent monsoon average. Temperature inversions trap emissions from local and regional sources, creating prolonged periods of hazardous air
| Year | Jan | Feb | Mar | Apr | May | Jun | Jul | Aug | Sep | Oct | Nov | Dec | Average |
|---|---|---|---|---|---|---|---|---|---|---|---|---|---|
| 2016 | |||||||||||||
| 2017 | 76.2 | 63.3 | 48.9 | 42.8 | 42.9 | 40.9 | 45.4 | 49.8 | 67.2 | 78.6 | 126.2 | 96.3 | 62.5 |
| 2018 | 142.0 | 58.1 | 57.5 | 46.7 | 30.8 | 44.5 | 116.1 | 76.8 | |||||
| 2019 | 78.1 | 43.7 | 29.5 | 52.9 | 50.4 | 57.0 | 52.8 | 41.4 | 61.0 | 78.5 | 77.8 | 109.0 | 64.7 |
| 2020 | 54.3 | 44.7 | 35.4 | 27.3 | 30.5 | 40.2 | 38.9 | 36.0 | 42.2 | 48.3 | 43.8 | 87.0 | 43.9 |
| 2021 | 230.4 | 259.2 | 75.5 | 50.4 | 42.6 | 52.6 | 53.4 | 53.7 | 58.7 | 58.6 | 61.2 | 85.0 | 101.3 |
| 2022 | 86.1 | 63.7 | 47.0 | 44.0 | 40.0 | 53.5 | 54.2 | 57.4 | 73.8 | 120.5 | 206.2 | 291.3 | 95.9 |
| 2023 | 136.9 | 90.0 | 61.4 | 39.1 | 39.9 | 47.5 | 43.1 | 52.4 | 59.7 | 89.4 | 162.6 | 185.8 | 84.0 |
| 2024 | 256.7 | 95.6 | 56.5 | 35.1 | 37.4 | 40.1 | 41.2 | 43.2 | 65.0 | 110.9 | 162.0 | 203.1 | 95.8 |
| 2025 | 129.7 | 69.0 | 44.2 | 57.6 | 54.6 | 42.6 | 66.4 |
Exhibit 7.2: The Seasonal Cycle of Peshawar’s Air Pollution (2017-2025). This heatmap visualises the monthly average PM2.5 concentrations for each year, revealing a stark and predictable pattern. Pollution consistently peaks during the winter months of November through February (purple) and recedes during the monsoon season (red), demonstrating that Peshawar’s ‘smog season’ is a chronic, recurring public health threat.
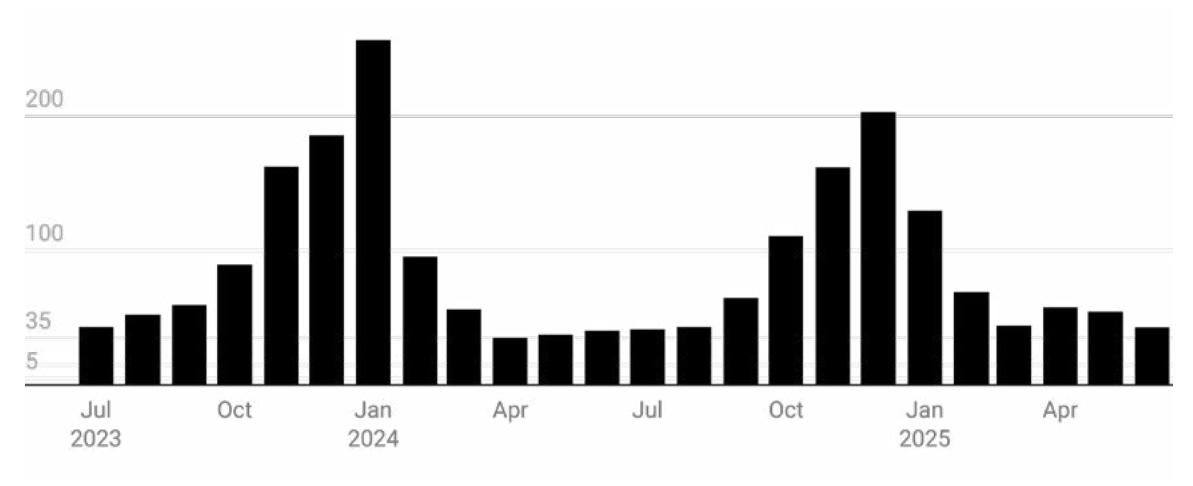
Exhibit 7.3: A Closer Look at Peshawar’s Recent Pollution Cycle (July 2023 to June 2025). This chart provides a detailed view of the most recent seasonal cycle, illustrating the dramatic rise in PM2.5 concentrations from the cleaner monsoon months to the hazardous winter peak. During the winter of 2023-2024, pollution levels were 4.1 times higher than the subsequent monsoon average.
quality. In 2024, residents experienced zero days where the air quality met WHO’s 24 hour guideline, while on 304 days, pollution was so high it also breached the national 24 hour legal limit.
Where transit and tradition collide
Peshawar’s emissions inventory reveals a pattern dominated by transportation but with substantial contributions from traditional industries that are central to the local economy.
- Transportation is the largest source, contributing 51% of PM2.5 emissions.
- Brick kilns are the second-most significant source, responsible for 19% of PM2.5 emissions.
- Small-scale traditional industries, such as metalworking and pottery, collectively contribute 14% of fine particulate matter.
The economic toll of unregulated growth
Peshawar’s economy is uniquely intertwined with its pollution sources. The heavy transit trade, while a vital economic driver, imposes significant health and infrastructure costs on the local population due to emissions from an aging, unregulated freight fleet. Similarly, the city’s traditional craft industries provide crucial livelihoods but operate with inefficient, polluting technologies. The economic imperative here is to decouple economic activity from environmental harm by modernising the logistics and artisanal sectors.
A path to cleaner air for Peshawar
Interventions must be tailored to address this unique blend of modern logistics and traditional economy.
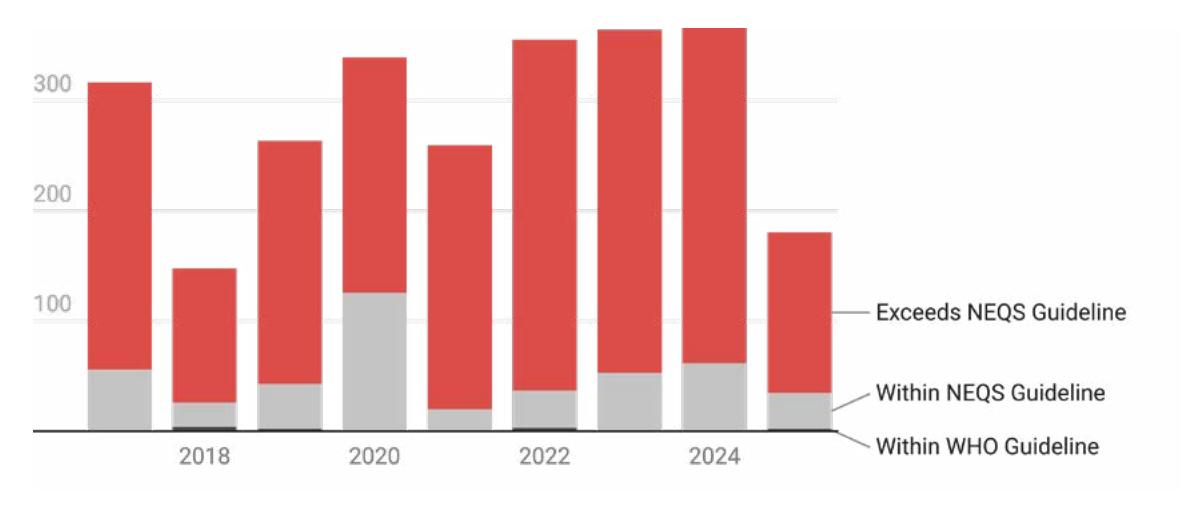
Exhibit 7.4: The Daily Health Burden in Peshawar (2024). This chart illustrates the daily reality of breathing Peshawar’s air. The complete absence of green (“Meets WHO Guideline”) shows that not a single day in 2024 had clean air. A staggering 304 days were so hazardous they breached Pakistan’s own National Environmental Quality Standard (NEQS), demonstrating a state of perpetual crisis.
1. Comprehensive transportation management
Given that transportation accounts for over half of the city’s PM2.5, a focused strategy to manage both local and transit traffic is essential, with a PM2.5 reduction potential of 20- 25%.
- Freight management system: Implement a system to regulate transit cargo, including designated routes away from populated centres, specified hours for heavy traffic, and mandatory vehicle inspections for all freight trucks passing through the airshed.
- Expand public transit: Continue to expand the Bus Rapid Transit (BRT) system to provide viable, affordable alternatives to private transport for a larger portion of the city’s residents.
2. Modernised brick kiln sector
The brick kiln sector is a major polluter and a prime target for high-impact emission reductions through technological upgrades, with a PM2.5 reduction potential of 15-18%.
- Complete technology transition: Accelerate and enforce the complete transition of all brick kilns in the airshed from traditional designs to modern zigzag technology.
- Dedicated industrial zones: Explore the creation of a dedicated industrial zone for brick manufacturing outside the main city basin, which could allow for shared pollution control infrastructure and better regulatory oversight.
3. Support for traditional industry
The goal for Peshawar’s artisanal industries should be modernisation—not elimination to preserve livelihoods while reducing environmental harm. This has a PM2.5 reduction potential of 10-12%.
— Cleaner production centres: Develop “cleaner production centres” for key artisanal
| Total annual emissions in kilotons in Peshawar | |||||
|---|---|---|---|---|---|
| Sector | PM2.5 | SO2 | NOx | CO | Total |
| Transport | 8.15 | 7.88 | 28.91 | 64.18 | 109.12 |
| Industry | 2.26 | 1.60 | 0.76 | 0.53 | 5.15 |
| Brick Kilns | 2.88 | 2.83 | 0.21 | 8.15 | 14.07 |
| Household | 1.12 | 0.02 | 0.94 | 6.91 | 8.99 |
| Waste | 1.10 | 0.02 | 0.02 | 3.17 | 4.31 |
| Commercial | 0.53 | 0.56 | 0.26 | 0.33 | 1.68 |
| Total | 16.04 | 12.91 | 31.10 | 83.27 | 143.32 |
Exhibit 7.5: A Mix of Ancient and Modern Sources. Peshawar’s inventory reflects its unique economy. The data shows a heavy reliance on transportation for transit trade, alongside significant emissions from traditional sectors like brick kilns and small-scale industries.
industries like metalworking and pottery. These centres could provide access to modern, more efficient, and less polluting equipment, along with training on best practices.
— Financial incentives: Provide financial support and incentives for small-scale industries to upgrade their technology and adopt cleaner fuels.
By pursuing a balanced approach that upgrades environmental performance while respecting cultural heritage, Peshawar can chart a distinctive path towards cleaner air. This transition would not only improve public health outcomes but also demonstrate how traditional knowledge and modern environmental science can work together to create sustainable urban futures.
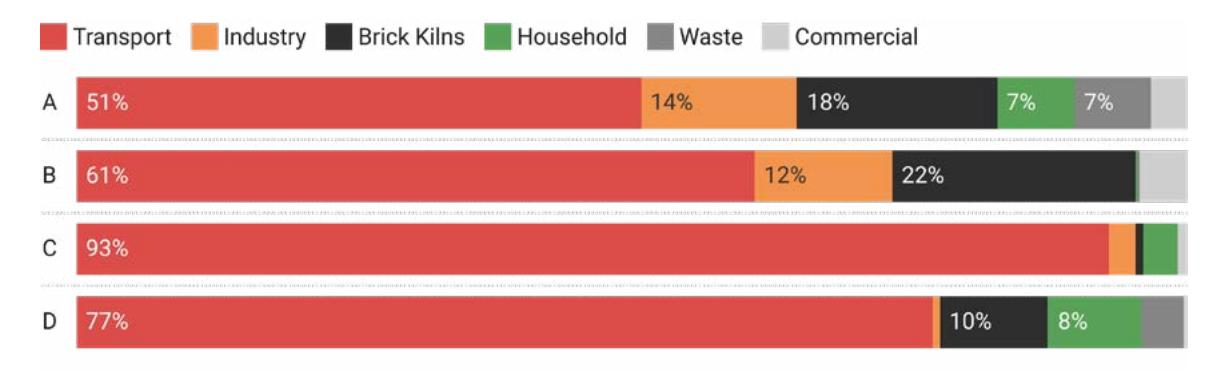
Exhibit 7.6: The Emissions Fingerprint of Peshawar. Peshawar’s air is poisoned by a trio of sources: transport, brick kilns, and industry. While the transport sector is the primary driver of NOx and CO, the most healthdamaging pollutants—PM2.5 and SO2—come from a dangerous mix of all three. This complex fingerprint means that an effective clean air strategy for Peshawar requires a three-front battle.
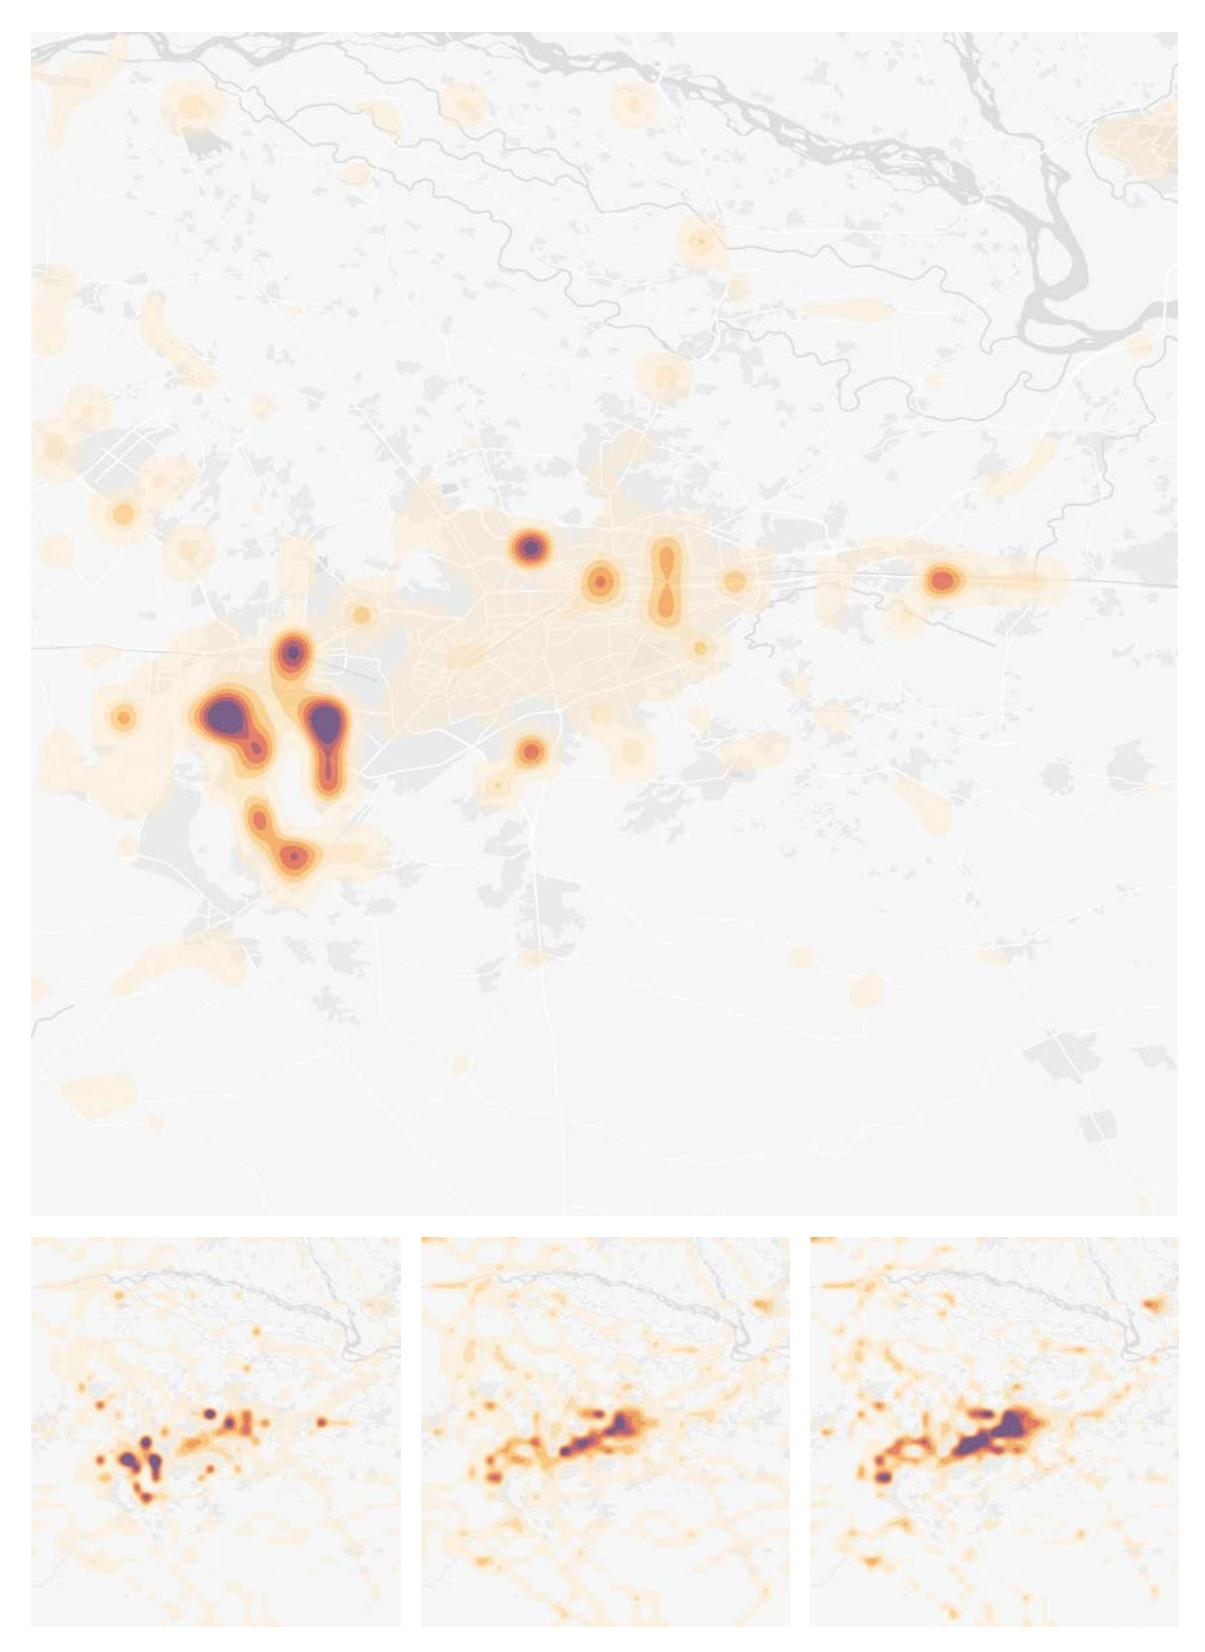
Exhibit 7.7: Spatial Distribution of Emissions in Peshawar (2021). These heatmaps show the concentration of PM2.5 (top), SO2 (left), NOx (middle), and CO (right) emissions. The data reveals pollution hotspots along major transportation corridors and in industrial zones, while also showing high-density pollution in the urban core due to traffic congestion and commercial activity.
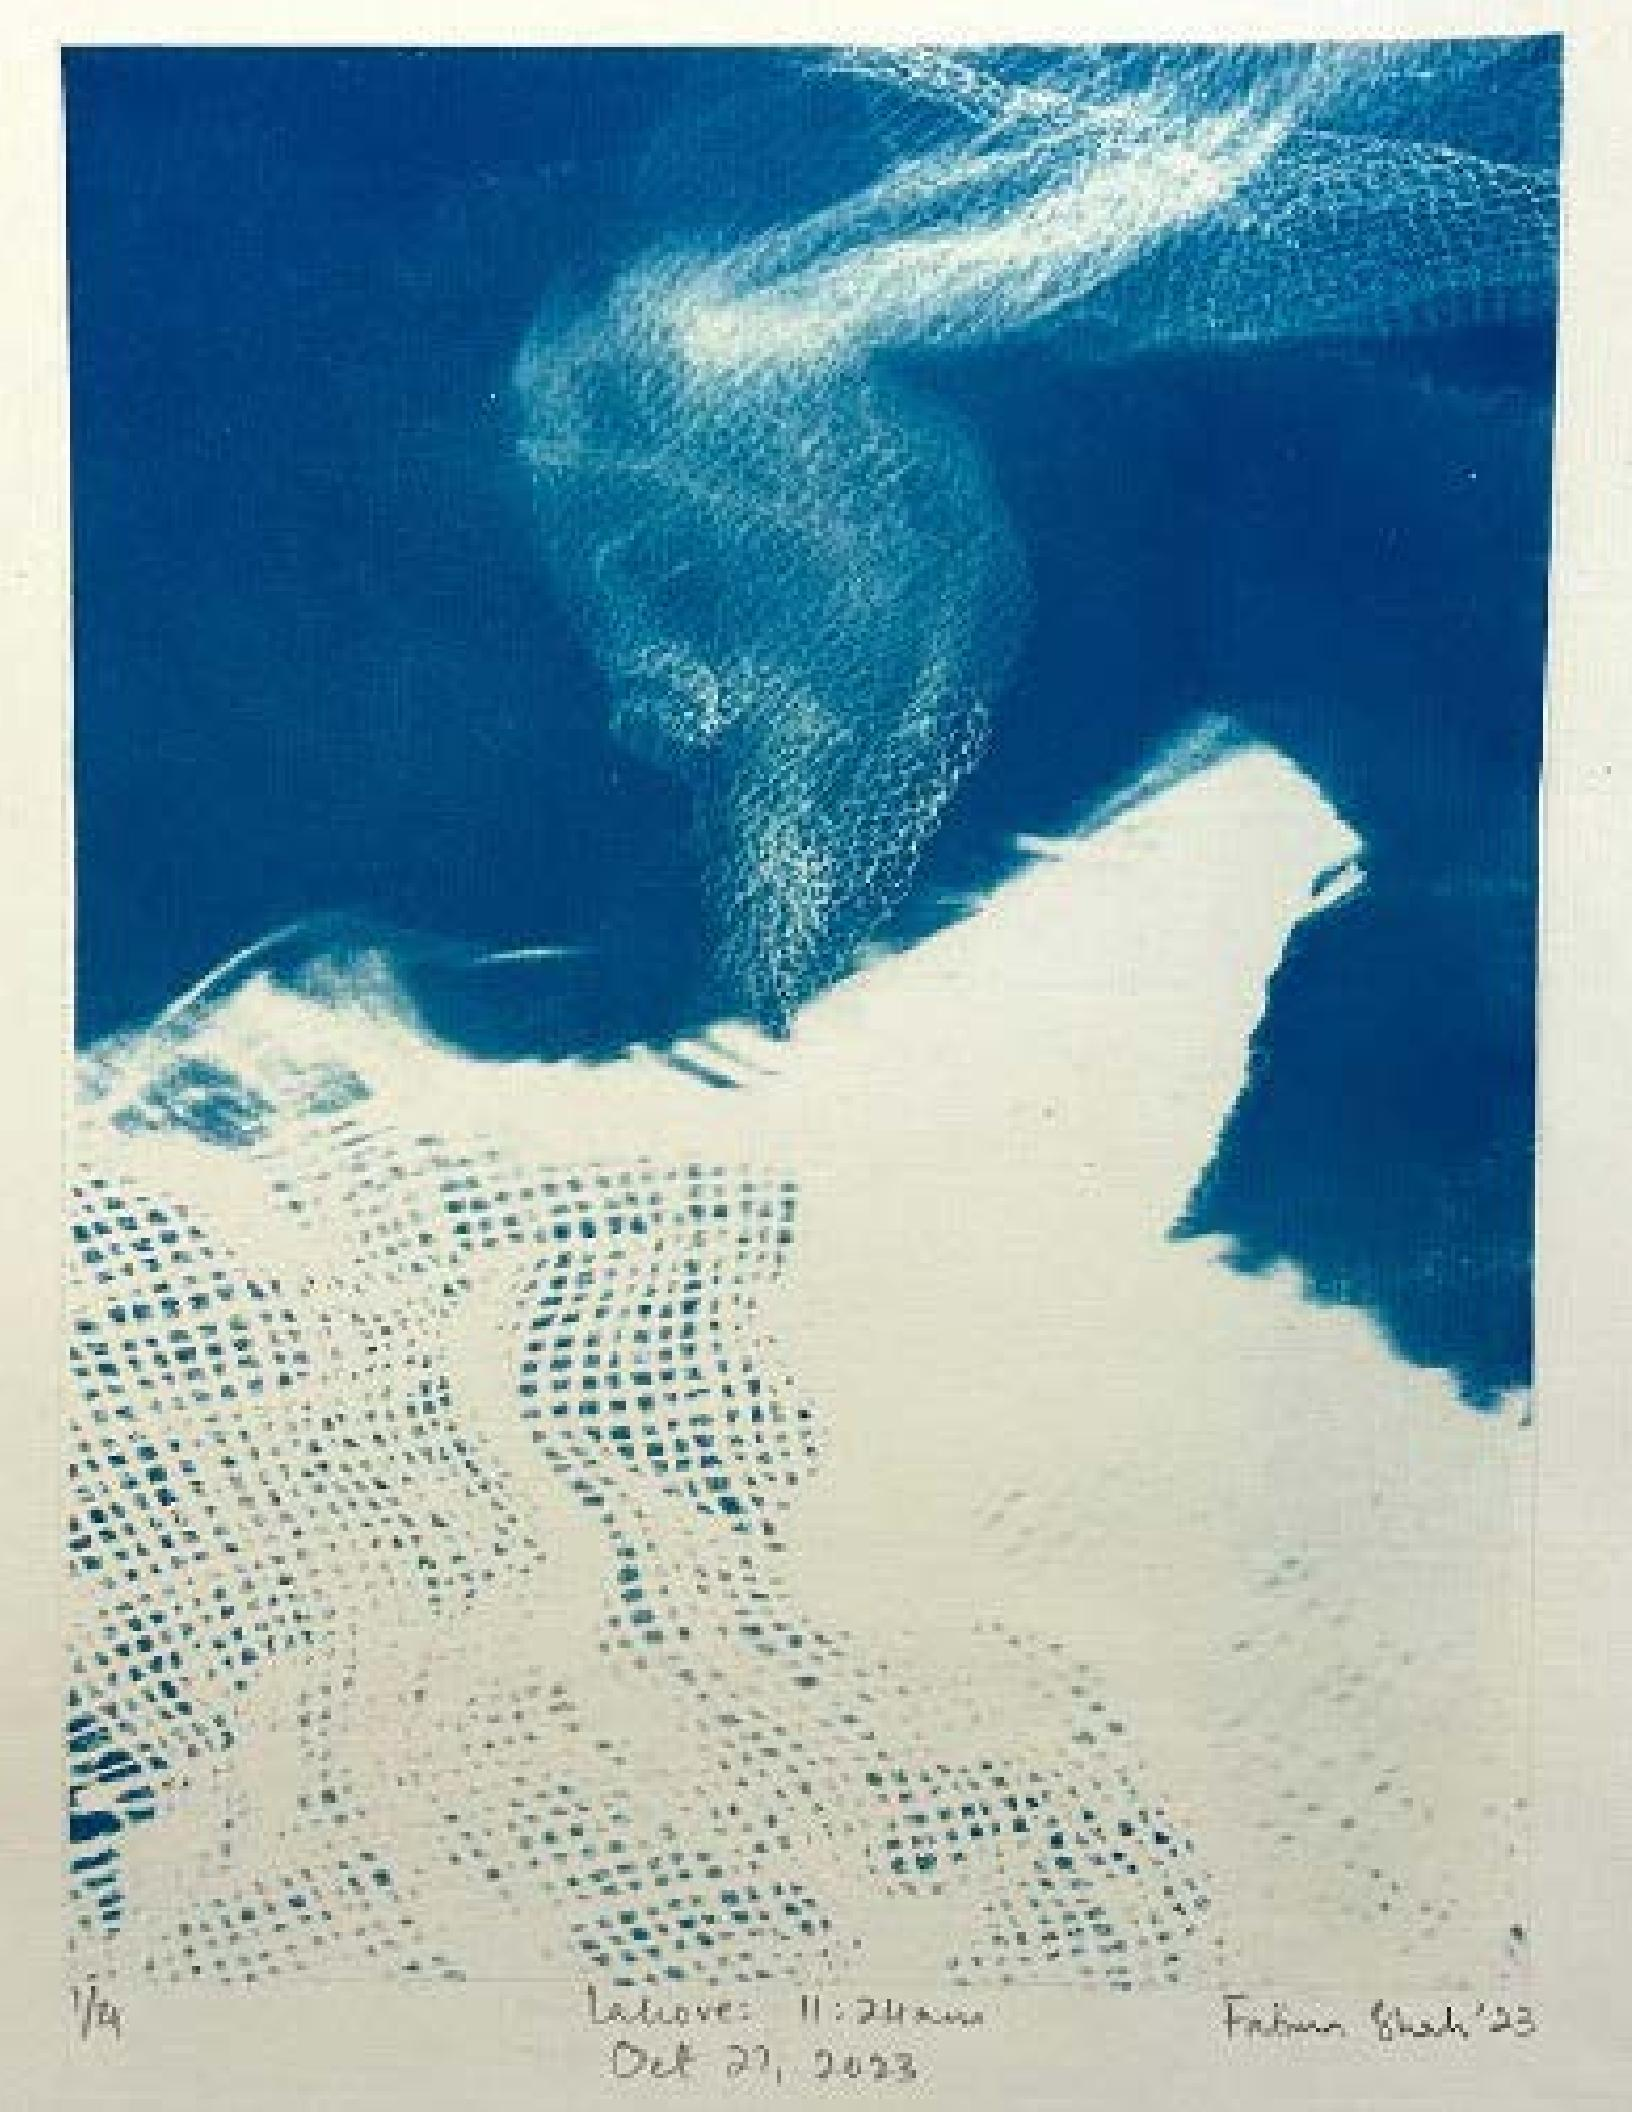
‘Lahore: 11:24 am | Oct 27, 2023’ and ‘Lahore: 12:16 pm | Oct 30,2023’ Fatima Shah transforms the cyanotype process into an index of toxicity, where the smog’s density dictates the print’s clarity. The mesh texture evokes a visceral sense of entrapment, while the fading image reveals a terrifying reality: pollution so thick it blots out the sun, erasing the city itself.
Lahore: 12:16 pm Oct 30, 2023