islamabad
Islamabad-Rawalpindi
PAQI Team ·
← Unveiling Pakistan's Air Pollution
A capital region choked by traffic
A crisis of urban design: The Islamabad-Rawalpindi airshed is a stark case study in how car-dependent urban planning drives pollution. The transportation sector is the dominant source, responsible for 53% of all PM2.5.
A tale of two cities: While sharing an airshed, Rawalpindi’s residents face far greater risk. Its annual pollution (61.1 µg/m³) is significantly higher than Islamabad’s (52.3 µg/m³), and it endured 199 hazardous days in 2024 compared to Islamabad’s 168.
A solvable problem: With minimal heavy industry, the region’s crisis is overwhelmingly caused by transport (53%), brick kilns (18%), and waste burning (11%). This makes it uniquely solvable through investments in public transit and sustainable urban planning.
A planned city, a capital built as a symbol of order, is now choking on the consequences of its own design. The haze over Islamabad and Rawalpindi is not the smoke of industry, but the exhaust of a million private journey—a self-inflicted crisis born from a failure to imagine a future beyond the automobile. This chapter is an accounting of that failure, providing the evidence that even without smokestacks, a city can suffocate on its own sprawl.
The Islamabad-Rawalpindi airshed, Pakistan’s third-largest urban area, presents a unique air quality challenge. This contiguous region, home to 8.5 million people, is characterised not by heavy industry but by high vehicle dependency—a stark case study of how urban design and mobility choices create severe public health emergencies. Air quality monitoring data reveals that Islamabad and Rawalpindi face distinct pollution realities.
A capital region’s chronic pollution
The nation’s capital region is not spared from the air quality crisis. For the 2024 calendar year, the combined airshed recorded an annual average PM2.5 concentration of 54.4 µg/m³, over 10 times the WHO safety guideline. This combined figure masks a significant disparity: Rawalpindi’s annual average was a hazardous 61.1 µg/m³, while Islamabad’s was a lower, but still dangerous, 52.3 µg/m³. This proves that transportation-driven pollution creates severe, but uneven, health risks across the airshed. While sharing an airshed, Rawalpindi’s residents face greater risk. Its annual pollution shortens the average resident’s life by 4.5
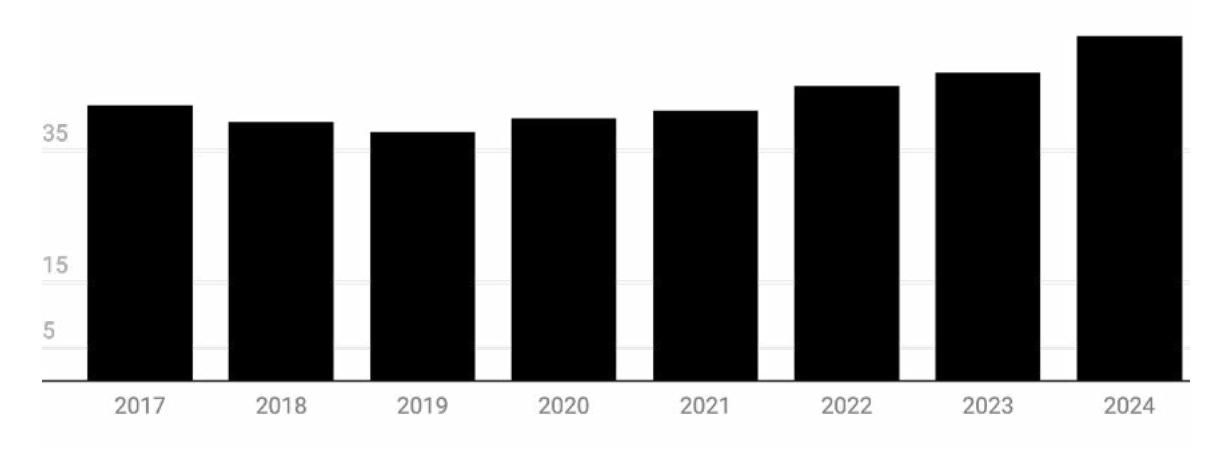
Exhibit 6.1: Islamabad’s Chronic Pollution Problem (Annual Averages 2017-2024). This chart shows the annual average PM2.5 concentration for Islamabad. While lower than in other major urban centres, the data reveals that the capital city still suffers from hazardous air quality that consistently fails to meet WHO guidelines.
years, compared to 4.1 years for Islamabad. In 2024, Rawalpindi endured 199 hazardous days compared to Islamabad’s 168.
Both cities experience a significant winter pollution peak. During the winter of 2023-2024, pollution levels surged to be 4.2 times higher than the subsequent monsoon average across the airshed. The daily data reveals the different levels of risk. In 2024, Islamabad experienced 22 days of good air by WHO standards. In contrast, Rawalpindi had only 11 such days. More alarmingly, Rawalpindi residents endured 199 days where pollution exceeded the national legal limit, compared to 168 days for Islamabad.
An emissions profile shaped by mobility
The emissions inventory for the airshed reveals a profile fundamentally shaped by mobility and construction, with industry playing a minimal role. The airshed is burdened annually
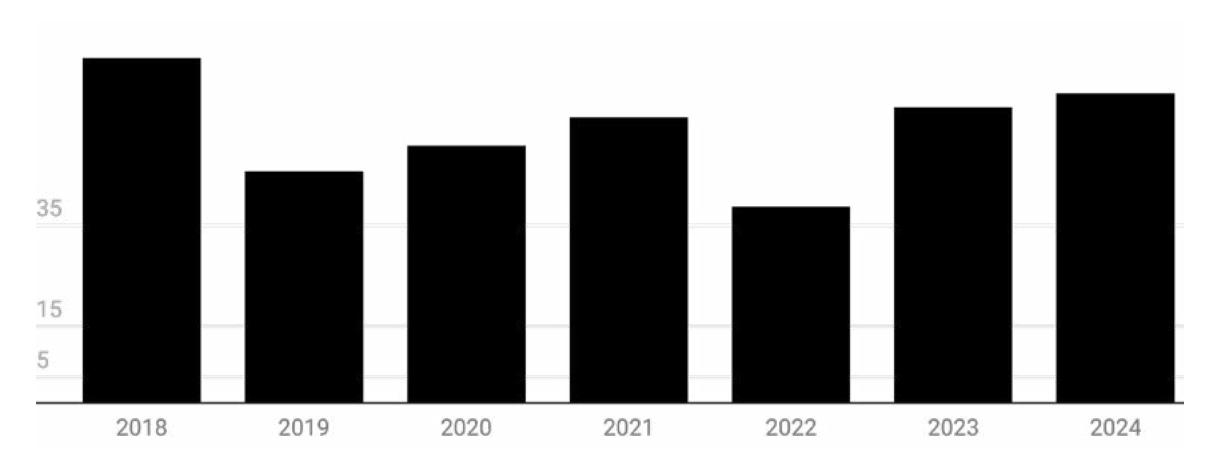
Exhibit 6.2: Rawalpindi’s Chronic Pollution Problem (Annual Averages 2018-2024). This chart shows the annual average PM2.5 concentration for Rawalpindi. The data reveals that while both cities suffer from hazardous air quality, Rawalpindi’s pollution levels are consistently and significantly higher than in its twin city, Islamabad.
| Year | Jan | Feb | Mar | Apr | May | Jun | Jul | Aug | Sep | Oct | Nov | Dec | Average |
|---|---|---|---|---|---|---|---|---|---|---|---|---|---|
| 2016 | 56.9 | 56.9 | |||||||||||
| 2017 | 93.7 | 36.9 | 34.9 | 24.8 | 29.8 | 29.0 | 31.6 | 30.4 | 35.7 | 59.9 | 77.5 | 46.0 | 41.8 |
| 2018 | 52.6 | 26.6 | 20.4 | 23.0 | 28.3 | 46.3 | 36.5 | 72.6 | 40.3 | 37.3 | 49.7 | 70.6 | 39.2 |
| 2019 | 37.4 | 24.7 | 18.6 | 17.7 | 24.2 | 25.0 | 31.6 | 29.7 | 43.8 | 46.9 | 50.7 | 102.0 | 37.8 |
| 2020 | 65.3 | 54.1 | 27.6 | 22.8 | 19.4 | 30.4 | 33.5 | 26.9 | 32.1 | 42.8 | 54.8 | 68.4 | 39.8 |
| 2021 | 71.6 | 70.3 | 28.8 | 18.3 | 19.2 | 24.6 | 26.9 | 34.5 | 37.5 | 32.0 | 54.1 | 76.2 | 41.0 |
| 2022 | 55.6 | 40.3 | 27.2 | 18.0 | 13.8 | 32.8 | 35.2 | 32.6 | 42.5 | 51.1 | 71.9 | 106.2 | 44.8 |
| 2023 | 75.9 | 53.8 | 39.4 | 26.7 | 24.3 | 30.3 | 26.5 | 33.9 | 34.9 | 45.7 | 73.6 | 96.1 | 46.8 |
| 2024 | 159.8 | 53.6 | 28.9 | 19.1 | 22.6 | 30.8 | 30.1 | 20.2 | 29.4 | 45.9 | 87.3 | 99.3 | 52.3 |
| 2025 | 78.3 | 49.2 | 23.0 | 32.0 | 30.8 | 35.2 | 41.4 |
Exhibit 6.3: The Seasonal Cycle of Islamabad’s Air Pollution (2016-2025). This heatmap visualises the monthly average PM2.5 concentrations for Islamabad, revealing a stark and predictable pattern where pollution peaks during the winter months of November through February.
| Year | Jan | Feb | Mar | Apr | May | Jun | Jul | Aug | Sep | Oct | Nov | Dec | Average |
|---|---|---|---|---|---|---|---|---|---|---|---|---|---|
| 2016 | |||||||||||||
| 2017 | |||||||||||||
| 2018 | 50.2 | 37.6 | 44.6 | 73.6 | 117.2 | 68.1 | |||||||
| 2019 | 80.0 | 58.5 | 39.3 | 32.1 | 25.6 | 24.2 | 32.9 | 26.6 | 37.7 | 34.0 | 46.1 | 111.0 | 45.7 |
| 2020 | 84.0 | 66.8 | 33.2 | 20.7 | 18.7 | 26.7 | 32.3 | 22.7 | 35.4 | 59.6 | 97.4 | 112.6 | 50.9 |
| 2021 | 116.7 | 104.5 | 43.0 | 25.5 | 30.2 | 33.9 | 33.6 | 38.7 | 39.6 | 45.7 | 91.3 | 80.0 | 56.4 |
| 2022 | 46.3 | 31.8 | 21.4 | 16.0 | 12.1 | 12.4 | 8.7 | 8.1 | 19.4 | 59.2 | 108.5 | 143.2 | 38.8 |
| 2023 | 106.1 | 93.6 | 55.2 | 31.6 | 24.9 | 26.8 | 26.6 | 37.8 | 42.2 | 54.6 | 93.5 | 109.7 | 58.4 |
| 2024 | 177.8 | 70.5 | 42.7 | 22.9 | 26.8 | 27.1 | 28.9 | 24.8 | 33.8 | 53.5 | 97.0 | 126.2 | 61.1 |
| 2025 | 93.3 | 52.1 | 25.1 | 25.5 | 24.0 | 28.4 | 41.4 |
Exhibit 6.4: The Seasonal Cycle of Rawalpindi’s Air Pollution (2018-2025). This heatmap visualises the monthly average PM2.5 concentrations for Rawalpindi. The intensity of the purple during winter months is visibly more pronounced than in Islamabad, highlighting the more severe seasonal pollution episodes in this part of the airshed.
with an estimated 12.04 kilotons of PM2.5, 11.37 kilotons of SO2, 21.87 kilotons of NOx, and 90.71 kilotons of CO.
The primary sources of fine particulate matter are:
Transportation is the undisputed primary source, contributing 53% of all PM2.5 emissions.
Brick kilns emerge as the second-largest source of PM2.5 at 18%.
Waste burning contributes a significant 11% of fine particulate matter.
Industrial activities have a minimal impact, contributing only 9% to PM2.5 emissions.
The economic drain of congestion
The transportation-driven pollution in the twin cities imposes direct economic costs through traffic congestion, which leads to wasted fuel and lost time, draining productivity. The reliance on imported fossil fuels for private transport also contributes to the national trade deficit. Investing in a comprehensive public transit system is therefore not only an environmental solution but also a sound economic strategy.
A path to cleaner air for the Twin Cities
To address this transportation-driven crisis, interventions must focus on mobility and sustainable development.
1. Transformative public transportation
The single most effective intervention for the airshed is a decisive shift away from private vehicles, with a PM2.5 reduction potential of 25-30%.
- Expand the metro bus network: Aggressively expand the existing Metro Bus network to create a comprehensive system that serves all major residential and commercial zones across both Islamabad and Rawalpindi.
- Electrify the public fleet: Prioritise the electrification of the public transit fleet, including buses and government vehicles, to create a zero-emission transport backbone for the capital region.
- Invest in non-motorised transport: Develop safe and connected infrastructure for walking and cycling to encourage a shift away from short-distance vehicle trips.
2. Integrated waste and dust management
With waste burning and construction dust as significant secondary sources, an integrated management approach with a combined PM2.5 reduction potential of 18-25% is crucial.
— Enforce dust control: Implement and strictly enforce comprehensive dust control measures at all public and private construction sites, including mandatory wetting, covering of materials, and vehicle wheel washing.
| Total annual emissions in kilotons in Islamabad-Rawalpindi | |||||
|---|---|---|---|---|---|
| Sector | PM2.5 | SO2 | NOx | CO | Total |
| Transport | 6.41 | 5.23 | 20.09 | 78.72 | 110.45 |
| Industry | 1.03 | 0.89 | 0.54 | 0.36 | 2.82 |
| Brick Kilns | 2.14 | 2.00 | 0.15 | 5.75 | 10.04 |
| Power | 0.03 | 3.07 | 0.34 | 0.03 | 3.47 |
| Household | 0.30 | 0.02 | 0.65 | 1.91 | 2.88 |
| Waste | 1.34 | 0.02 | 0.02 | 3.84 | 5.22 |
| Commercial | 0.79 | 0.14 | 0.08 | 0.10 | 1.11 |
| Total | 12.04 | 11.37 | 21.87 | 90.71 | 135.99 |
Exhibit 6.5: A Transport-Driven Crisis. This inventory confirms that the capital region’s pollution is largely a result of urban design. With minimal heavy industry, the data shows that the transport sector is the overwhelming driver of the airshed’s emissions load.
— Modernise solid waste management: Develop and implement a modern, city-wide solid waste management system for both cities to eliminate the practice of open garbage burning.
3. Modernised brick kiln sector
The high contribution from brick kilns, despite the region’s limited industrial base, makes them a key target with a PM2.5 reduction potential of 15-18%.
- Accelerate technology transition: Enforce and accelerate the complete conversion of all brick kilns in the airshed to zigzag and next-generation technologies.
- Focus on upwind sources: Prioritise the modernisation and regulation of kilns located upwind of Rawalpindi, which are likely to have a disproportionate impact on the city’s air quality.
By pivoting decisively towards sustainable transportation integrated with smart urban development, the twin cities can transform from a car-dependent sprawl to a model of sustainable urbanism. As the nation’s capital, successful air quality improvements here would demonstrate political commitment and create a powerful template for action across Pakistan.
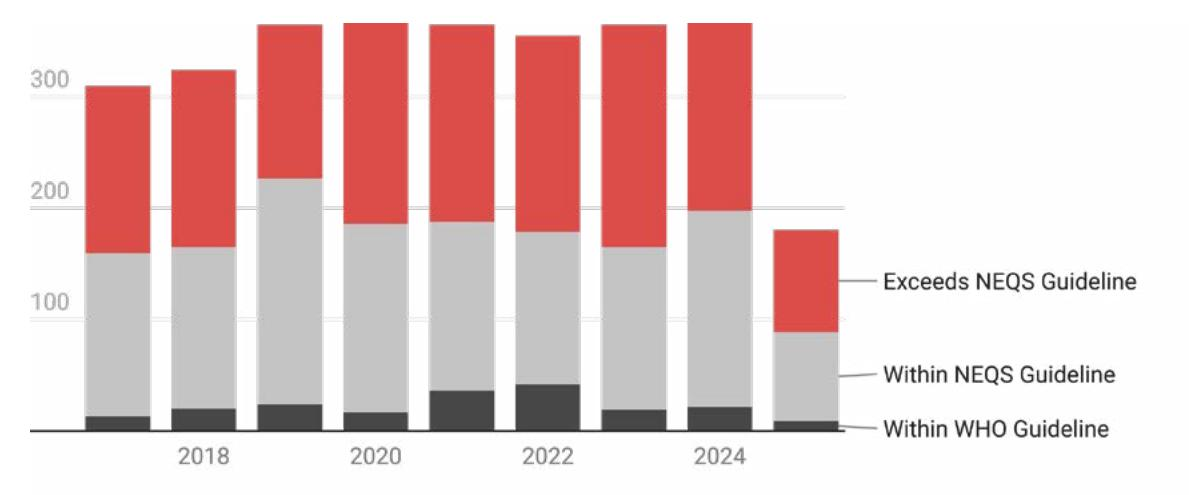
Exhibit 6.6: The Daily Health Burden in Islamabad. This chart illustrates the daily reality of breathing Islamabad’s air. Even in the capital, days meeting the WHO clean air guideline are a minority, while the number of days exceeding the national standard remains high, demonstrating a year-round health risk.
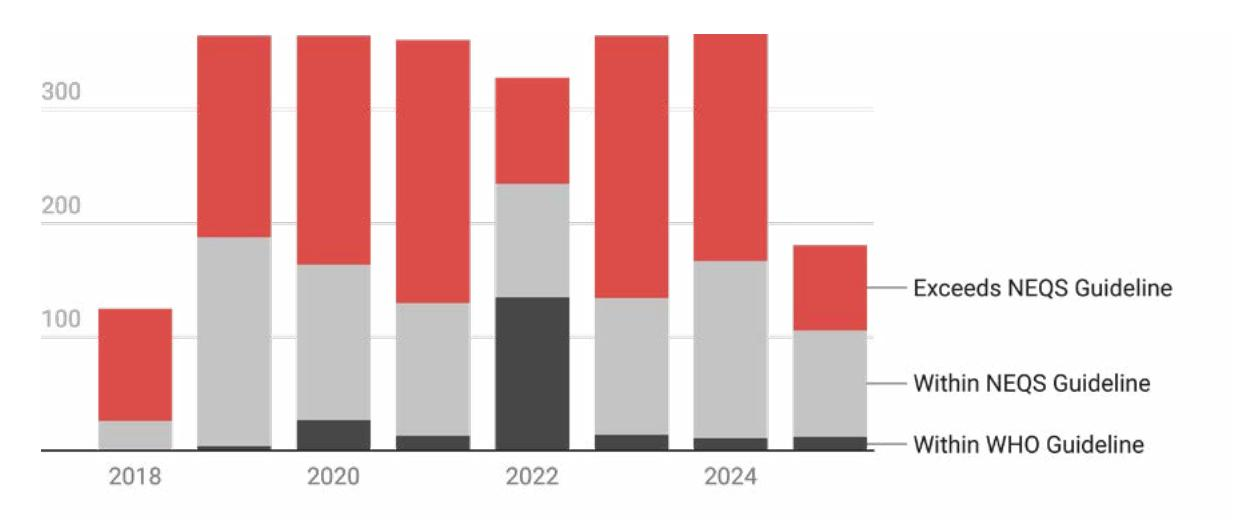
Exhibit 6.7: The Daily Health Burden in Rawalpindi. This chart illustrates the more severe daily health burden in Rawalpindi. Compared to Islamabad, the city experiences far fewer clean air days and a significantly higher number of days when pollution breaches the national legal limit, highlighting the unequal risk within the airshed.
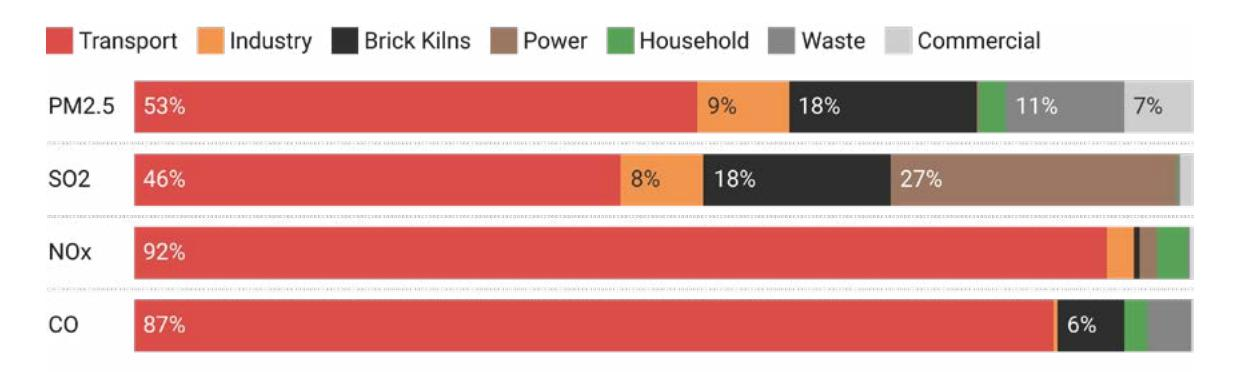
Exhibit 6.8: The Emissions Fingerprint of the Twin Cities. In the Islamabad-Rawalpindi airshed, all roads lead to one culprit: transportation. The transport sector is the overwhelming source of nearly every major pollutant, including PM2.5 (53%), NOx (92%), and CO (87%). Unlike Pakistan’s other major urban centres, this unique emissions fingerprint points to a clear and singular priority: an effective clean air strategy for the Twin Cities must begin and end with a radical transformation of its transport sector.
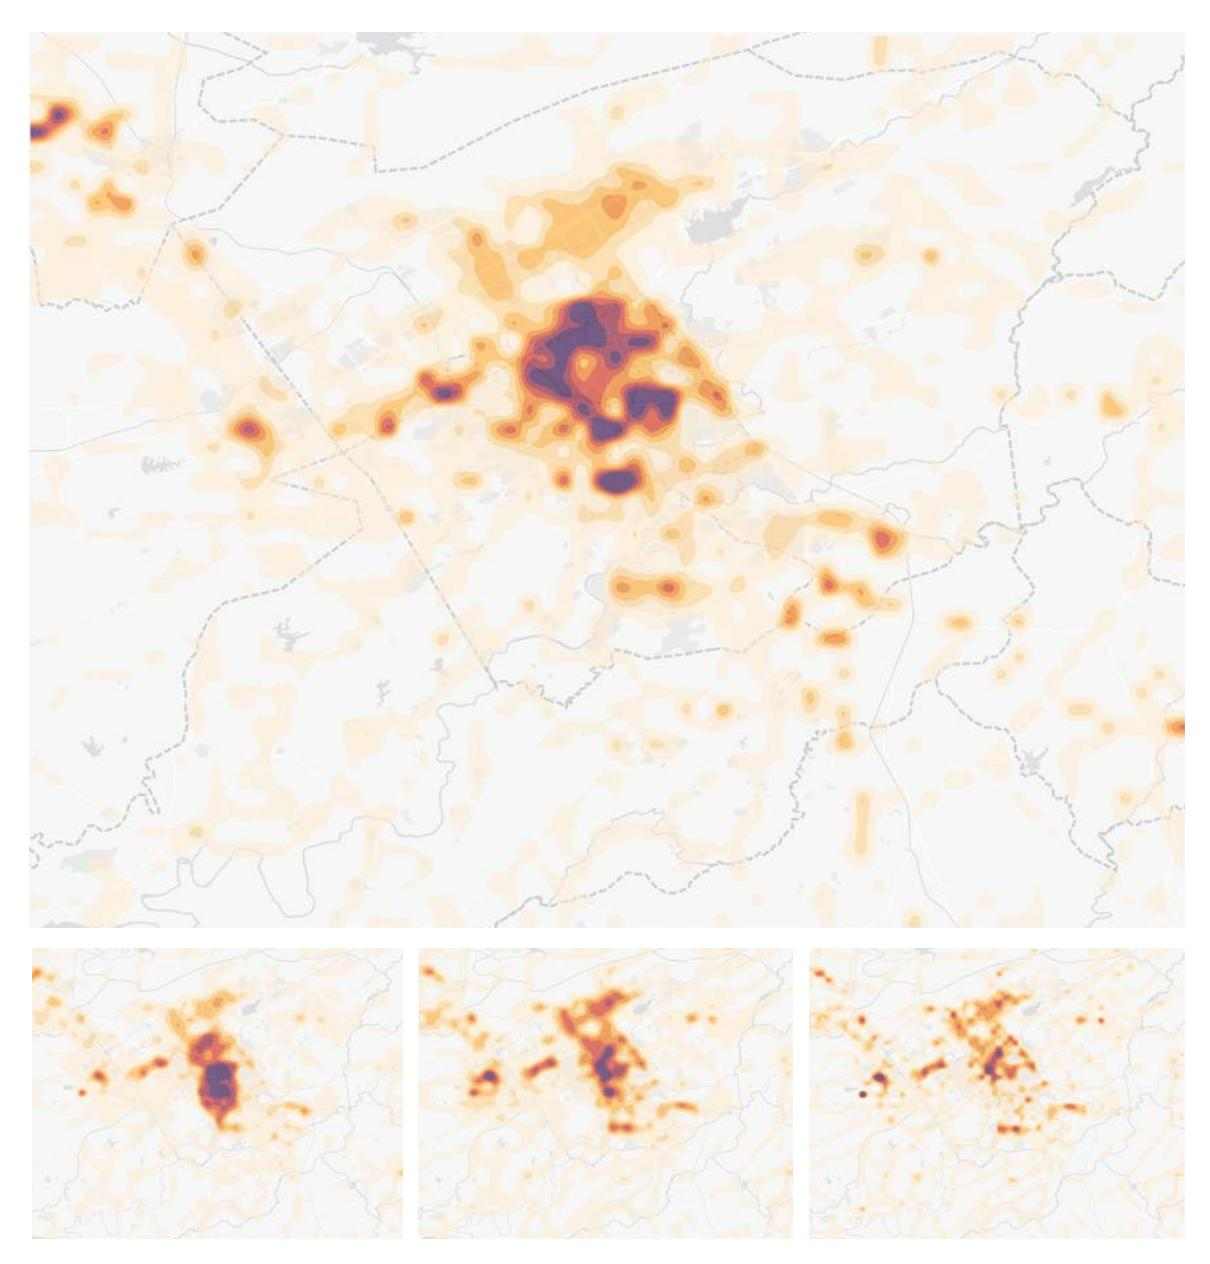
Exhibit 6.10: Spatial Distribution of Emissions in the Twin Cities (2021). These heatmaps show the concentration of PM2.5 (top), SO2 (left), NOx (middle), and CO (right) emissions. The data reveals pollution hotspots along major transportation corridors like the Islamabad Expressway and Murree Road, which directly connect the two cities.
