Karachi
PAQI Team ·
← Unveiling Pakistan's Air Pollution
An industrial crisis: Karachi’s air pollution is overwhelmingly driven by its industrial sector, which is responsible for nearly half (49%) of all health-damaging fine particulate matter (PM2.5).
A constant health threat: Karachi’s air was unhealthy by WHO standards on 363 days in 2024. The annual average of 46.2 µg/m³ is over 9 times the global health guideline, costing the average resident 2.7 years of life expectancy.
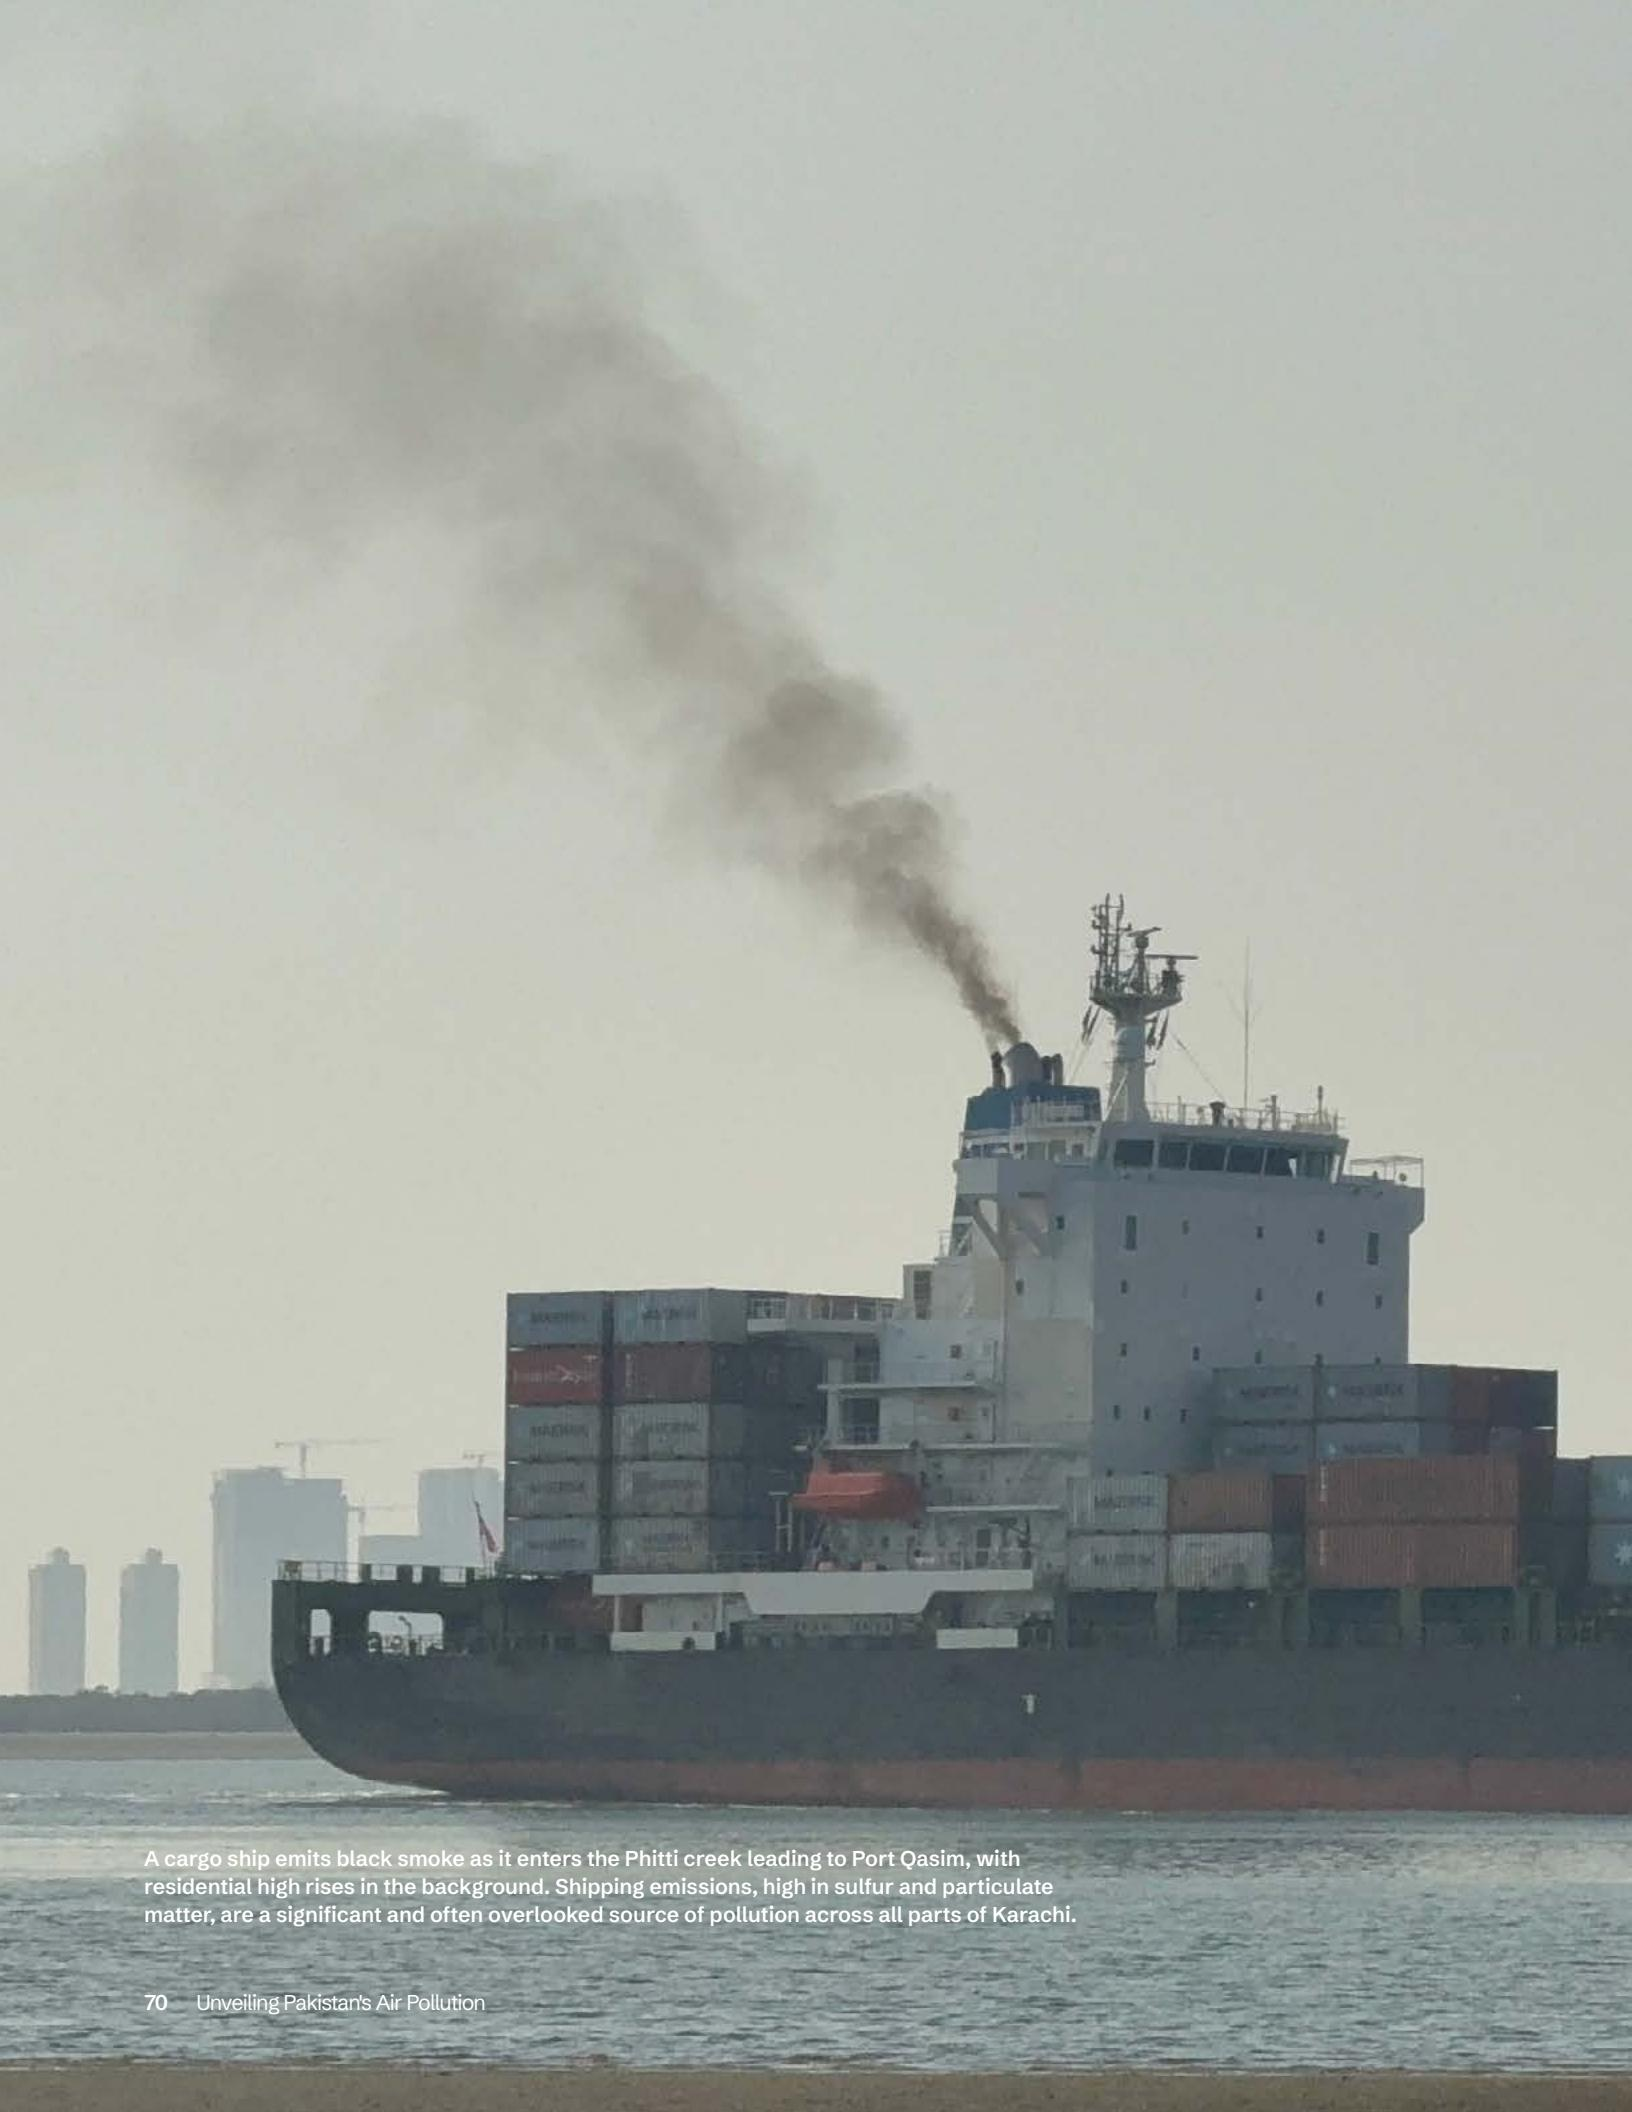
Unique port city challenges: Emissions from two major seaports, the nation’s largest fleet of heavy-duty diesel trucks, and thousands of diesel water tankers create a pollution profile unlike any other city, demanding a strategy focused on industry, freight, and fuel quality.
For decades, Karachi’s haze has been accepted as the inevitable byproduct of its economic might: the cost of being Pakistan’s largest city, its industrial heart, and its gateway to the world. This chapter rejects that premise. It provides evidence to prove that the city’s toxic air is not a sign of progress, but of inefficiency, and that a healthier, more competitive Karachi is possible when its industrial and economic engines are powered by clean air.
As Pakistan’s largest city and economic engine, Karachi confronts a distinct air quality challenge. This is not just a city of factories, but a complex ecosystem of logistics, where the country’s largest concentration of heavy-duty trucks moves between ports and industrial zones, and thousands of diesel water tankers serve as a mobile fleet of polluters. Home to 21 million people, its pollution profile is dominated by a vast industrial base and two major seaports, creating an emissions landscape different from any other Pakistani urban centre. While often perceived to have better air due to its coastal location, the data reveals a year-round public health crisis that consistently fails to meet both national standards and global health guidelines. This chapter builds upon the foundational data and analysis first presented in PAQI’s 2025 emissions inventory specific to the city, Unveiling Karachi’s Air. 1
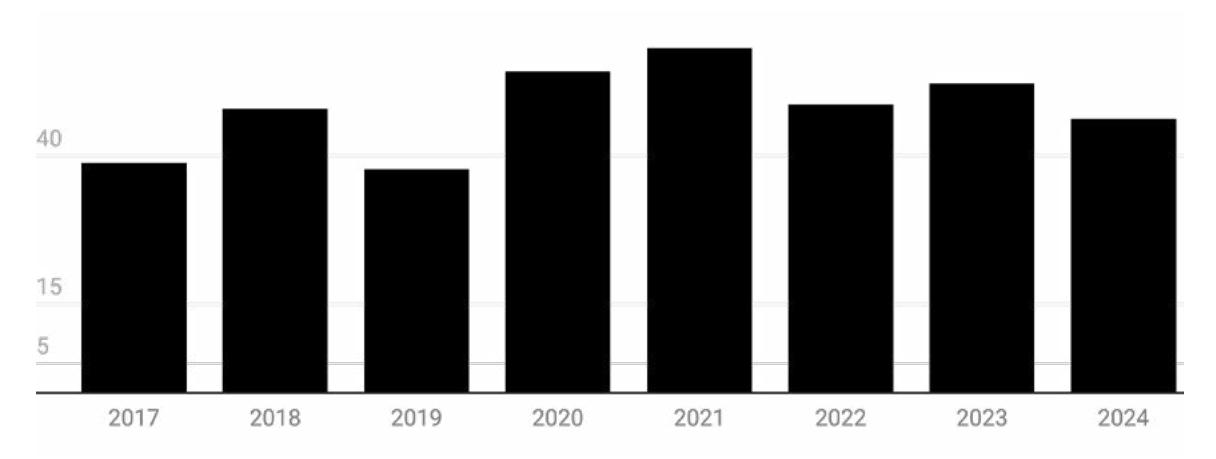
Exhibit 5.1: Karachi’s Chronic Pollution Problem (Annual Averages 2017-2024). For the last eight years, Karachi’s air has never met WHO’s safe guideline. The annual average pollution consistently exceeds even the National (NEQS) and provincial Sindh Environmental Quality Standards (SEQS), with no significant trend of improvement.
An industrial city’s constant haze
Karachi’s air pollution is not a seasonal event but a chronic condition driven by its relentless industrial and economic activity. In 2024, the city’s annual average PM2.5 concentration was 46.2 µg/m³. This level is over 9 times WHO’s annual health guideline and more than three times Pakistan’s own National Environmental Quality Standards (NEQS) and the provincial Sindh Environmental Quality Standards (SEQS).2 1 This data confirms that even with the coastal breeze that helps disperse air pollution, Karachi’s own human-caused emissions create a constant public health emergency.

Exhibit 5.2: The Daily Health Burden in Karachi (2016-2025). This chart illustrates the daily reality of breathing Karachi’s air. The small segments at the bottom highlight how exceptionally rare clean air days are according to WHO guidelines. Note: *Data for 2016 is partial. **Data for 2025 is for the year-to-date.
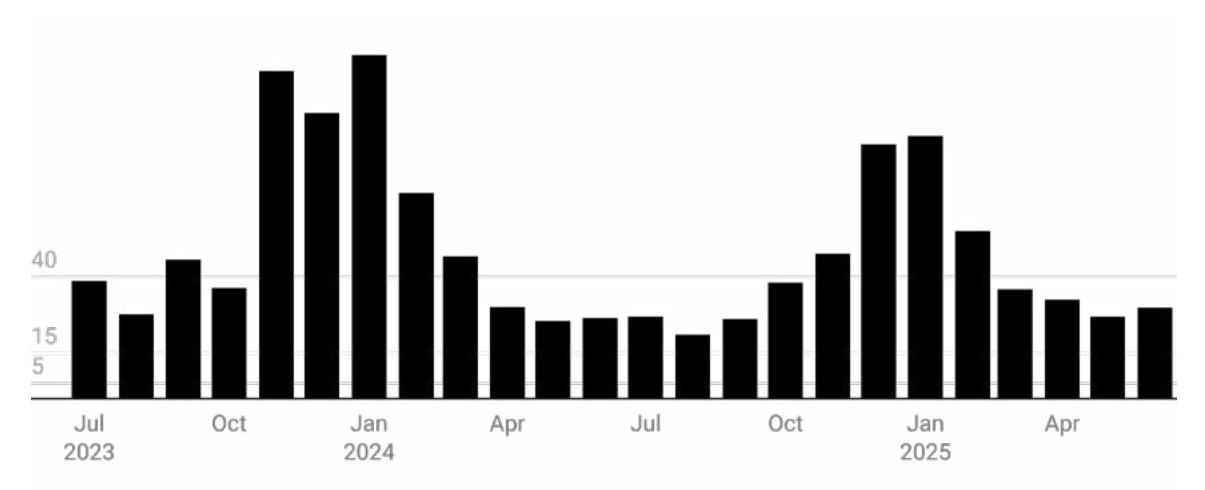
Exhibit 5.3: Karachi’s Seasonal Pollution Cycle (Monthly Averages July 2023 to June 2025). This chart of monthly average PM2.5 concentrations reveals a stark and predictable seasonal pattern. Pollution levels consistently begin to rise in October and peak dramatically during the winter months, creating a prolonged season of hazardous air.
While Karachi does not experience the extreme winter smog of inland cities in Punjab, a clear seasonal pattern persists. During the winter of 2023-2024, pollution levels were 4.3 times higher than the subsequent monsoon average. The sea breeze provides some dispersion, but not enough to overcome the combined effect of winter meteorology and the city’s massive emissions load. In 2024, only 3 days met WHO’s daily guideline, while on 70 days, pollution was so high it exceeded legal limits set by the Sindh Environmental Protection Agency (SEPA).
| Year | Jan | Feb | Mar | Apr | May | Jun | Jul | Aug | Sep | Oct | Nov | Dec | Average |
|---|---|---|---|---|---|---|---|---|---|---|---|---|---|
| 2016 | 27.9 | 63.0 | 65.7 | 53.5 | |||||||||
| 2017 | 86.8 | 60.0 | 29.2 | 25.9 | 41.7 | 24.4 | 22.9 | 19.1 | 17.6 | 32.1 | 62.4 | 67.5 | 38.8 |
| 2018 | 80.8 | 59.3 | 44.6 | 54.1 | 41.7 | 43.2 | 42.5 | 37.2 | 23.1 | 46.3 | 49.8 | 49.4 | 47.9 |
| 2019 | 50.4 | 23.9 | 20.7 | 13.3 | 11.4 | 12.4 | 13.9 | 17.6 | 37.8 | 55.2 | 71.9 | 122.8 | 37.7 |
| 2020 | 83.4 | 72.3 | 42.0 | 27.5 | 26.2 | 27.3 | 26.2 | 26.7 | 33.8 | 52.0 | 109.3 | 126.7 | 54.3 |
| 2021 | 87.5 | 103.1 | 45.6 | 41.7 | 31.6 | 32.7 | 29.5 | 24.5 | 33.3 | 54.3 | 99.0 | 90.8 | 58.2 |
| 2022 | 67.1 | 50.8 | 45.0 | 36.9 | 40.5 | 26.3 | 21.0 | 29.7 | 33.0 | 47.9 | 74.8 | 112.1 | 48.7 |
| 2023 | 89.5 | 64.4 | 50.9 | 29.6 | 27.2 | 29.6 | 31.1 | 27.8 | 45.7 | 36.4 | 107.9 | 94.0 | 52.2 |
| 2024 | 113.7 | 67.7 | 46.9 | 30.2 | 25.7 | 26.6 | 27.1 | 21.0 | 26.3 | 38.1 | 47.7 | 83.8 | 46.2 |
| 2025 | 86.4 | 55.1 | 35.9 | 32.5 | 27.0 | 30.0 | 44.5 |
Exhibit 5.4: The Seasonal Cycle of Karachi’s Air Pollution (2016-2025). This heatmap visualises the monthly average PM2.5 concentrations for each year, revealing a stark and predictable pattern. Pollution consistently begins to rise in October (red), peaks dramatically during the winter months of November through February (purple), and recedes during the monsoon season (orange). This demonstrates that Karachi’s ‘smog season’ is not an occasional event but a chronic, recurring public health threat each winter.
| Total annual emissions in kilotons in Karachi | |||||
|---|---|---|---|---|---|
| Sector | PM2.5 | SO2 | NOx | CO | Total |
| Transport | 12.77 | 20.29 | 81.11 | 183.87 | 298.04 |
| Industry | 19.10 | 13.37 | 9.55 | 6.59 | 48.61 |
| Power | 1.34 | 15.66 | 8.11 | 0.90 | 26.01 |
| Household | 0.56 | 0.04 | 1.49 | 3.67 | 5.76 |
| Waste | 2.68 | 0.04 | 0.04 | 7.68 | 10.44 |
| Commercial | 2.66 | 2.12 | 0.48 | 0.70 | 5.96 |
| Total | 39.11 | 51.52 | 100.78 | 203.41 | 394.82 |
Exhibit 5.5: Karachi’s Industrial-Heavy Inventory. Unlike Pakistan’s other cities, Karachi’s pollution profile is defined by industry. This breakdown reveals that industrial activities generate nearly half of the city’s PM2.5, overshadowing even the transport sector.
The price of inefficient industry
Unlike any other major city in Pakistan, Karachi’s air pollution is overwhelmingly driven by its industrial sector. This inventory estimates Karachi’s annual emissions at 39.11 kilotons of PM2.5, 51.52 kilotons of SO2, 100.78 kilotons of NOx, and 203.41 kilotons of CO.
Industrial sources are the largest contributor, responsible for nearly half (49%) of all PM2.5 emissions.
Transportation is the second-largest source at 33% of PM2.5, but it dominates NOx emissions (80%).
Power generation facilities contribute a major share of sulfur dioxide (30%).
For Karachi, the economic case for clean air is inseparable from its identity as an industrial and commercial hub. High emissions are symptoms of inefficiency, outdated technology, and poor fuel quality—all of which undermine the long-term competitiveness of its core economic sectors. Investing in cleaner industrial processes and modernising port logistics is not just an environmental measure; it is a strategy for improving operational efficiency, reducing fuel costs, and meeting international supply chain standards.
These emissions are exacerbated by systemic challenges unique to the city. The heavy reliance on an aging diesel truck fleet is compounded by the widespread use of low-quality or smuggled fuels with high sulfur content, drastically increasing emissions. Furthermore, the city’s water supply gaps have created a unique pollution source: a mobile fleet of thousands of diesel-powered water tankers operating daily. This combination of industrial scale, port logistics, and specific urban challenges defines the core of Karachi’s air quality crisis.
A path to cleaner air for Karachi
Karachi’s unique emissions profile requires a strategy focused on its economic drivers. The following evidence-based interventions could reduce urban PM2.5 emissions by up to 50%.
1. Industrial emission controls
With industry responsible for nearly half of all PM2.5, modernising this sector is the single most impactful intervention for Karachi, with a PM2.5 reduction potential of 20-25%. This requires a regulatory push to close the technology and enforcement gap.
- Control technologies: Mandate and enforce the use of Best Available Control Technologies (e.g., Electrostatic Precipitators, Flue Gas Desulfurisation) in all major industries, particularly in the steel, cement, and textile sectors.
- Continuous monitoring: Require Continuous Emissions Monitoring Systems (CEMS) for all large industrial facilities to ensure compliance and provide transparent, real-time data.
- Fuel quality: Enforce fuel standards for industrial boilers and furnaces to phase out the use of high-sulfur furnace oil.
2. Heavy-duty vehicle regulation
Karachi’s economy runs on diesel, and the emissions from its massive fleet of trucks and buses are a primary cause of toxic NOx and a major source of PM2.5. A dedicated strategy for this sector has a PM2.5 reduction potential of 15-20%.
- Vehicle inspections: Implement a targeted and rigorous inspection and maintenance programme for commercial diesel vehicles, which are the highest emitters in the transport fleet.
- Low Emission Zones: Establish LEZs in port-adjacent areas and key industrial corridors
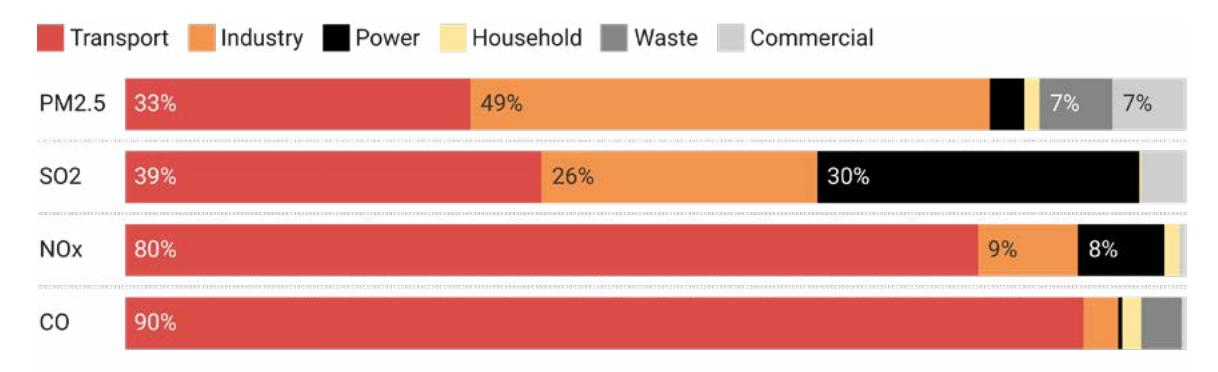
Exhibit 5.6: The Emissions Fingerprint of Karachi’s Pollutants. Karachi’s air is poisoned by its two great economic engines: industry and transport. Industrial emissions are the primary source of the most health-damaging pollutant, PM2.5, while the city’s vast transportation network is the overwhelming source of NOx and CO. An effective clean air strategy for Karachi must therefore be a two-front war, tackling both industrial and transport sectors with equal force.
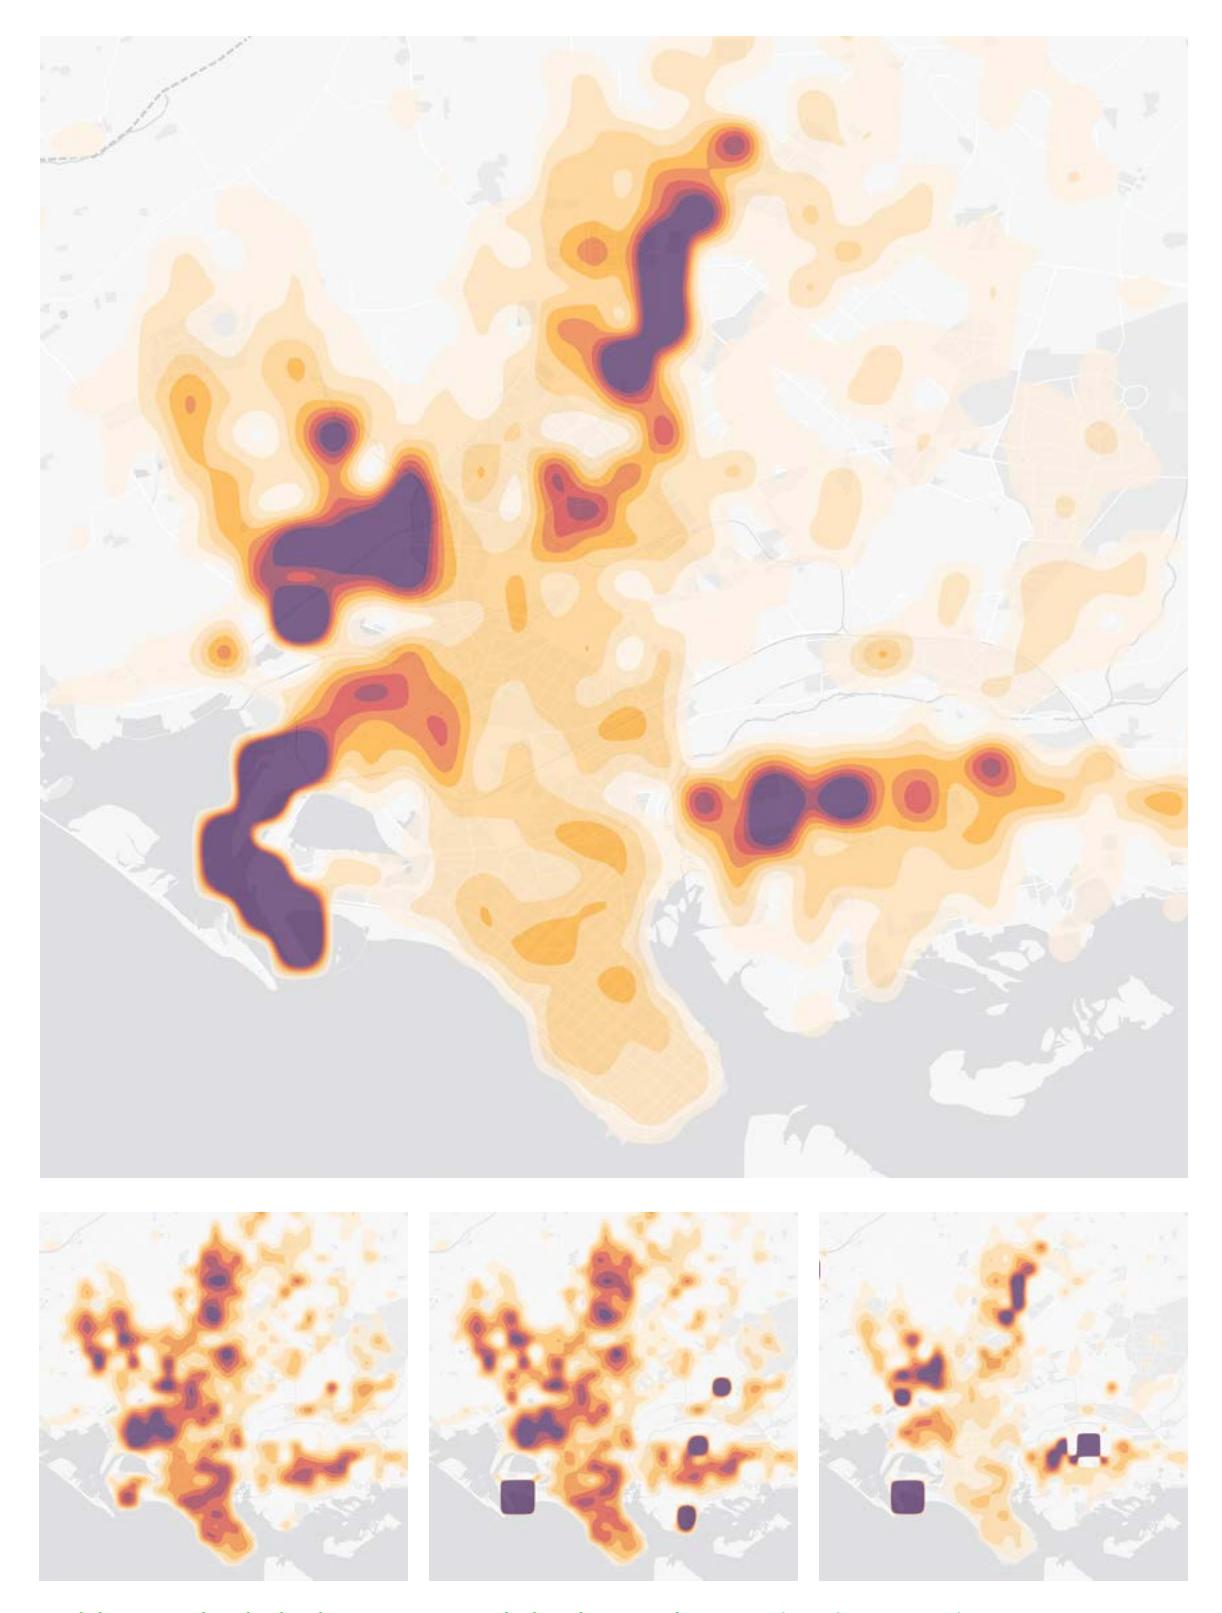
Exhibit 5.7: Spatial Distribution of Pollutant Emissions in Karachi (2021). This series of maps illustrates the calculated distribution of annual emissions for PM2.5 (top), SO2 (left), NOx (middle), and CO (right) across Karachi at a 1km x 1km resolution. Darker shades indicate higher emission densities, highlighting hotspots in industrial zones (like Korangi and Landhi), around port areas, and along major transportation routes.
to restrict the most polluting trucks and accelerate fleet renewal.
— Freight management: Optimise truck movements between ports and industrial zones to reduce congestion, idling times, and associated emissions.
3. Port and shipping interventions
As Pakistan’s primary maritime gateway, Karachi’s two major ports are a unique and significant pollution source that require a dedicated strategy, with a PM2.5 reduction potential of 8-10%.
- Shore power: Introduce shore power facilities for docked vessels to allow them to turn off their high-emitting auxiliary engines while at berth.
- Fuel sulfur requirements: Enforce stringent fuel sulfur limits for all vessels operating within port boundaries, a proven strategy for reducing SO2 and particulate emissions.
- Electrification: Transition port-based cargo handling equipment from diesel to electric power where feasible.
By systematically addressing its primary industrial and maritime emission sources, Karachi can achieve a transformative improvement in its air quality and demonstrate that robust economic growth and environmental protection are complementary objectives.
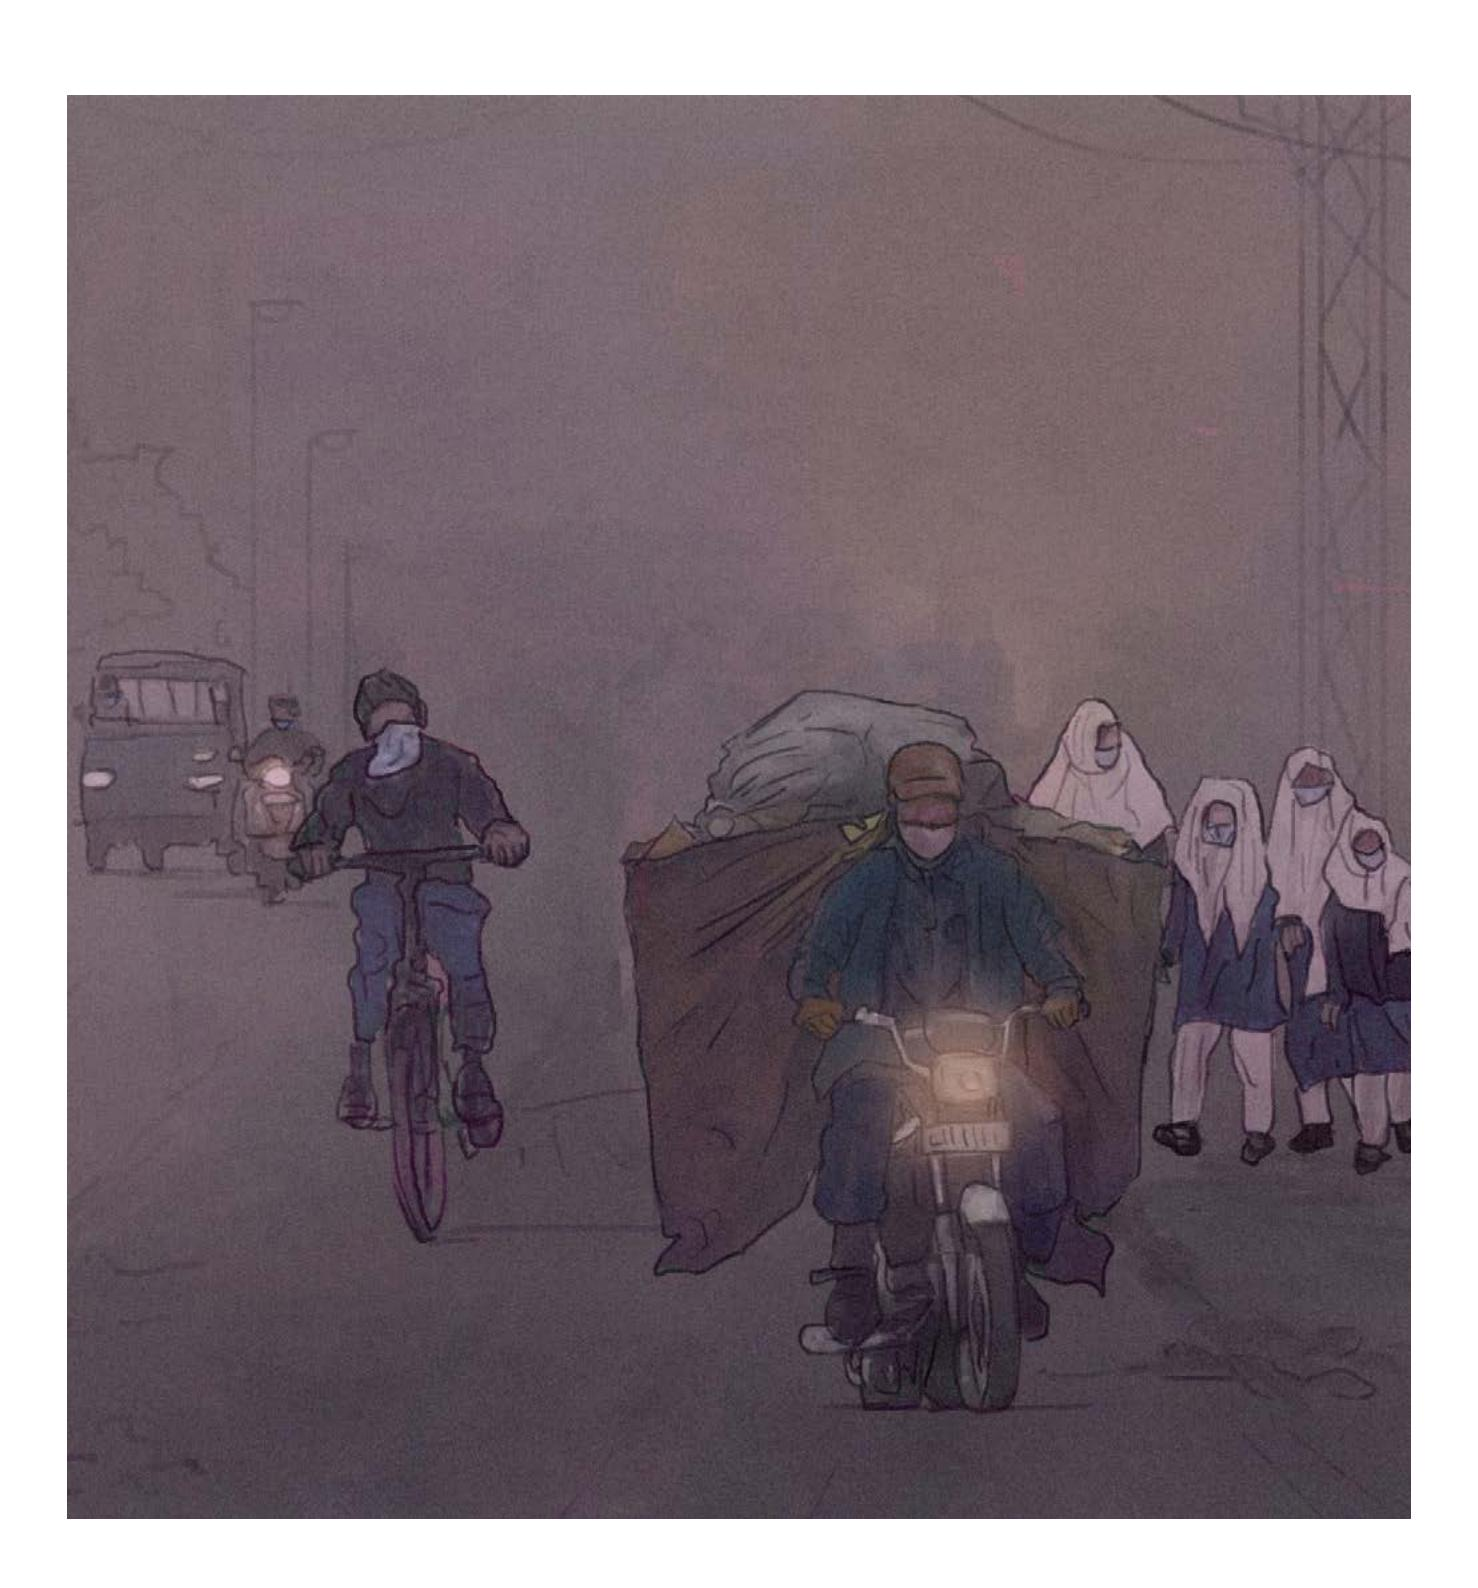
Cyclists, motorcyclists, and families in open rickshaws navigate a grey, choked streetscape in this illustration by Itrat Jabeen. The work highlights the unequal burden of air pollution, where those contributing the least to emissions often face the most direct and unfiltered exposure to toxic fumes.
Footnotes
-
Government of Sindh, Environmental Protection Agency. (2016). Sindh Environmental Quality Standards, Notification No.EPA/TECH/739/2014. ↩