emissions-inventory
A National Emergency
PAQI Team ·
← Unveiling Pakistan's Air Pollution
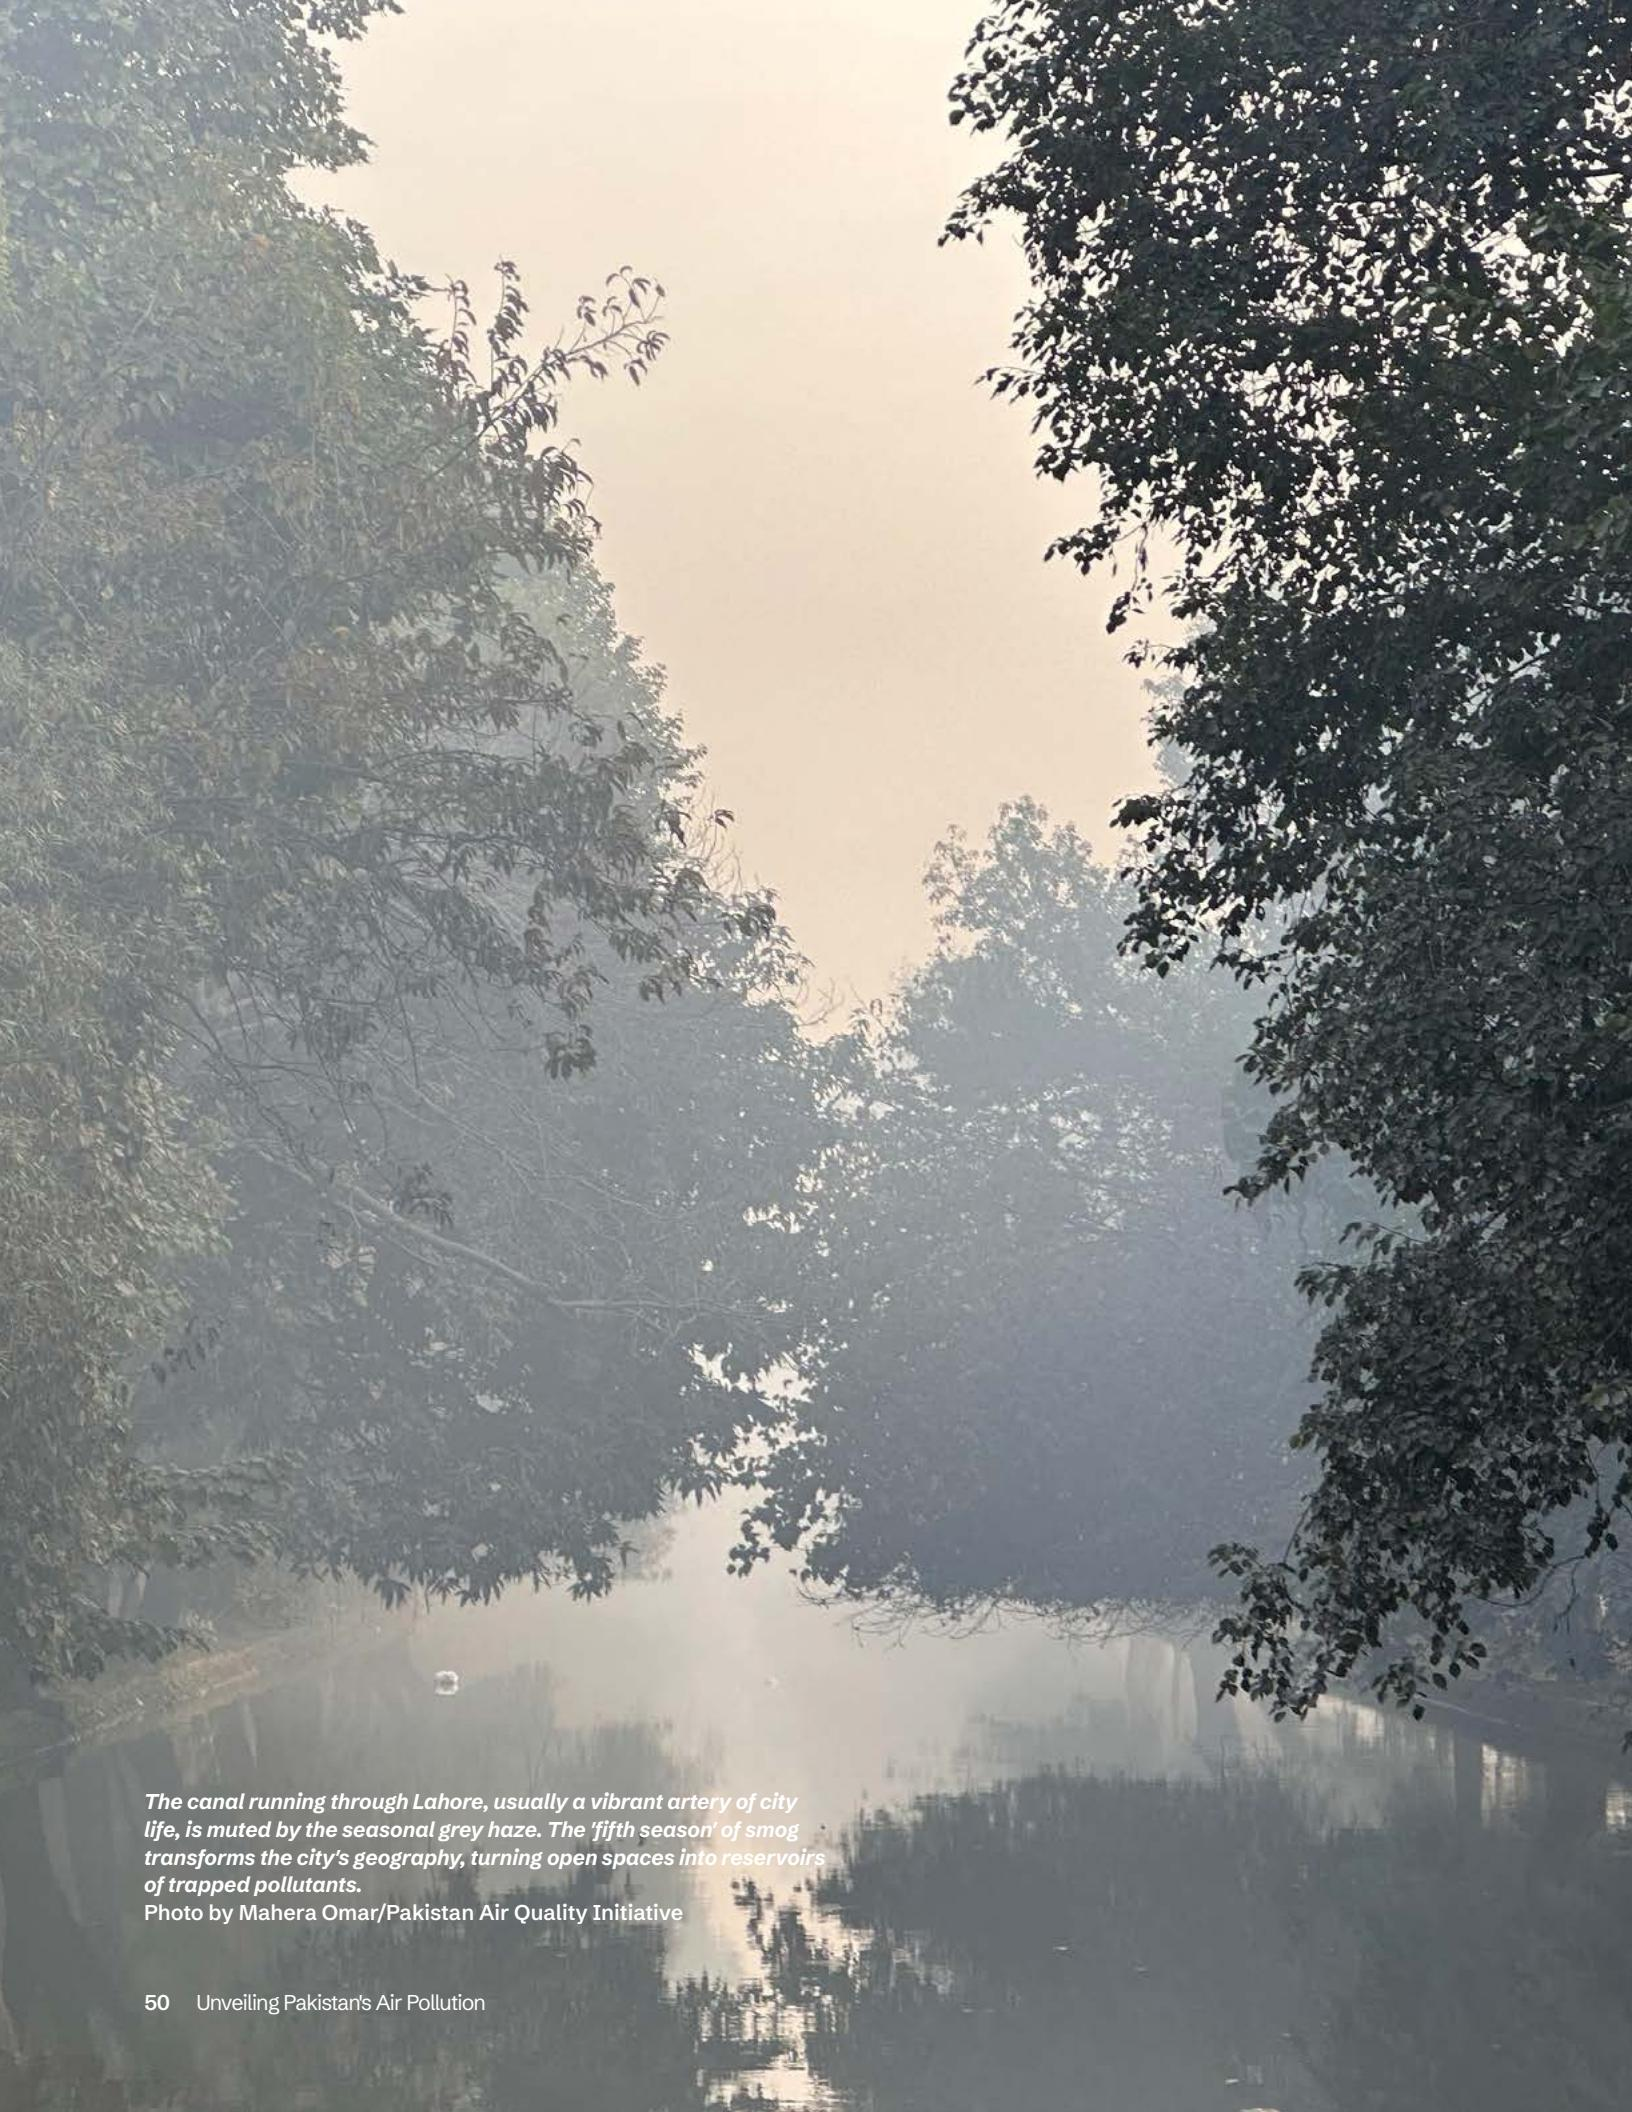
The scale and consequences of Pakistan’s air pollution problem
Public health crisis: Air pollution is a national emergency that reduces the life expectancy of an average Pakistani by 3.9 years.
Unique local sources: Each major city has a unique emissions fingerprint requiring targeted, local solutions.
Failure of governance: Systemic failures in governance underpin the crisis, in implementing environmental regulations and National Environmental Quality Standards (NEQS).
There is a quiet war being waged on the citizens of Pakistan. It is a war fought not with armies, but with apathy, with flawed policies, and with an air so toxic that it has begun to erase our futures. For too long, the sources of this poison were allowed to remain a convenient mystery. This report is an act of defiance against that silence; it is a scientific accounting of our crisis, designed not just to be read, but to be used: as evidence, as a weapon, and as a blueprint for reclaiming the air we breathe.
Recent years have witnessed a dramatic deterioration in Pakistan’s air quality, with major cities regularly recording particulate matter concentrations among the world’s worst. These dangerous pollution levels translate directly to severe public health impacts, from increased respiratory and cardiovascular disease to reduced cognitive development in children. The consequences are measured in years of life lost. According to the Air Quality Life Index (AQLI), chronic exposure to particulate pollution shortens the life of an average resident of Pakistan by 3.9 years.1
This local crisis is part of a global pollution pandemic. The Lancet Commission on Pollution and Health found that pollution is responsible for approximately 9 million premature deaths globally each year—equivalent to one in every six deaths worldwide.2 The commission
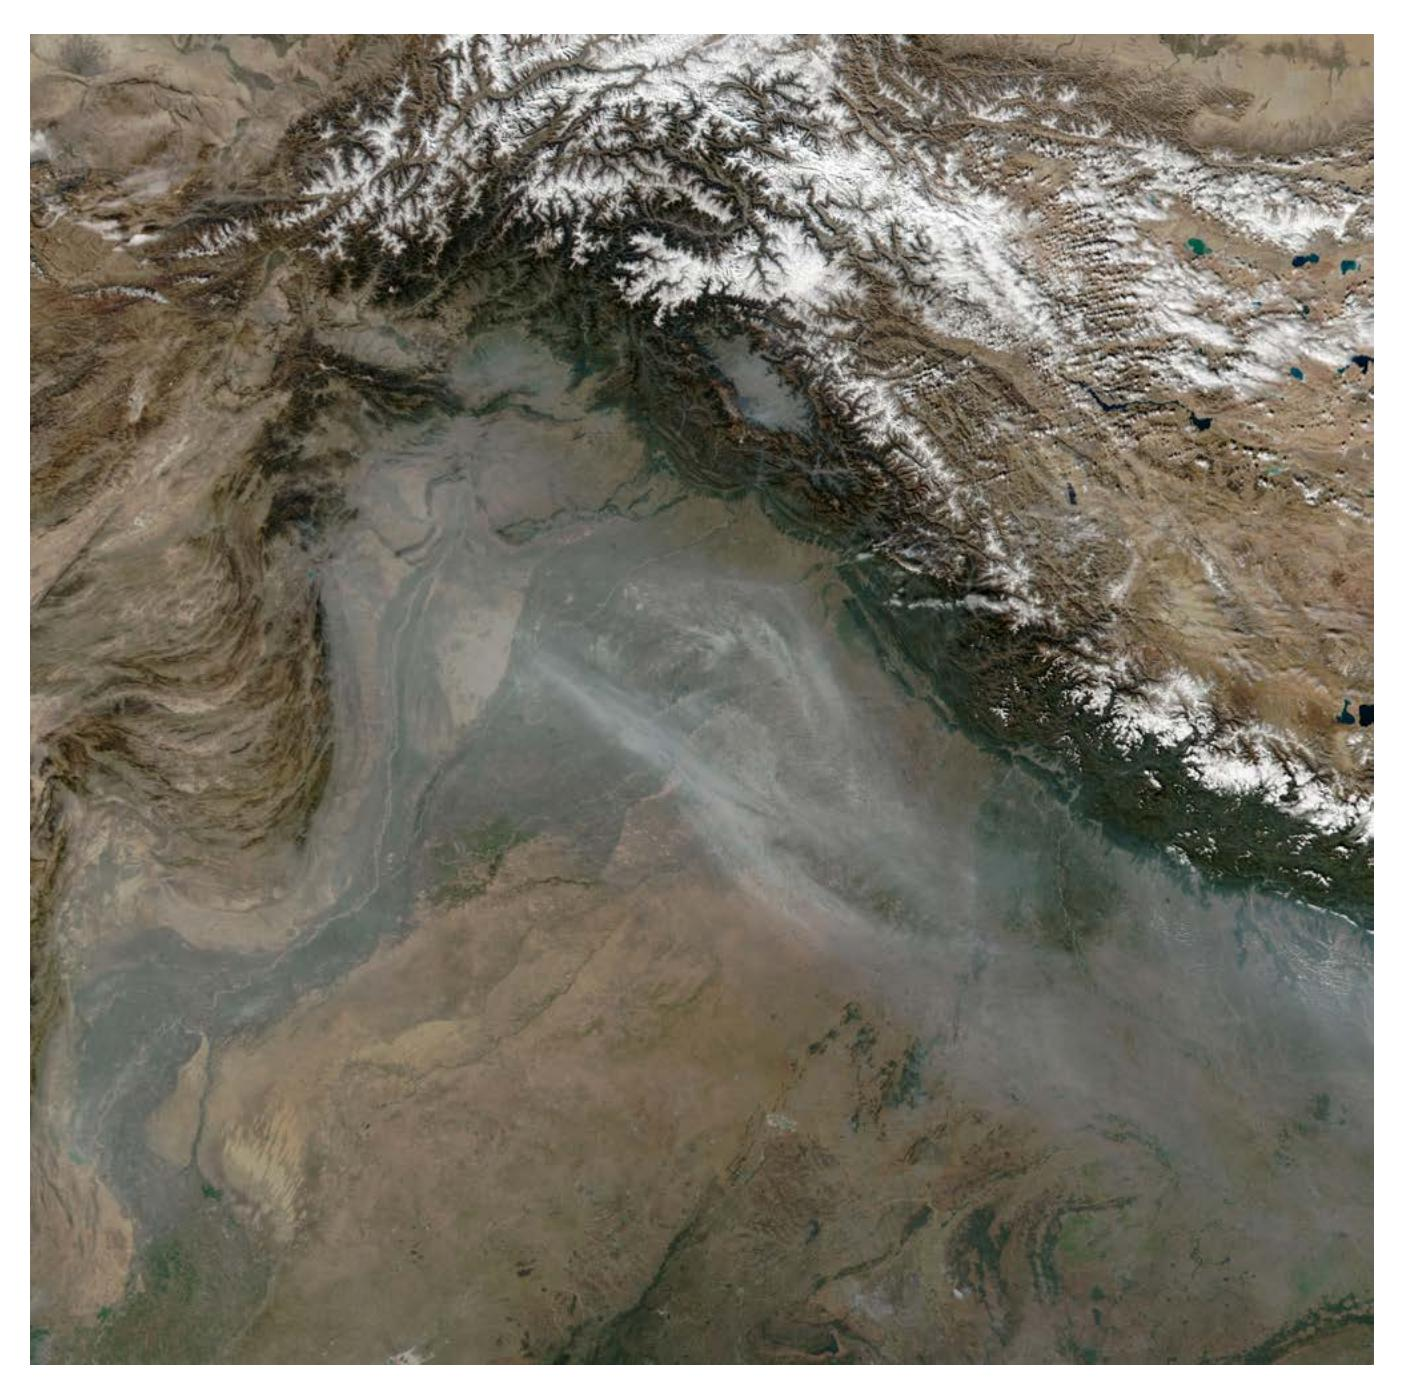
Exhibit 3.1: Smoky Skies Over the Indo-Gangetic Plain (NASA): A view from space reveals the sheer scale of the crisis, as a thick, grey blanket of smog obscures the Indus Basin. This NASA satellite imagery underscores that air pollution is a massive, transboundary phenomenon that respects no administrative lines, trapping millions in a shared atmospheric emergency.
| Total annual emissions in kilotons | Emissions in kilograms per person per year | ||||||||||
|---|---|---|---|---|---|---|---|---|---|---|---|
| Airshed | Population | PM2.5 | SO2 | NOx | CO | Kilotons | PM2.5 | SO2 | NOx | CO | Kilograms |
| Karachi | 21 million | 39.12 | 51.52 | 100.79 | 203.42 | 789.69 | 1.86 | 2.45 | 4.8 | 9.69 | 37.6 |
| Lahore | 17 million | 26.68 | 39.81 | 52.65 | 207.07 | 326.21 | 1.57 | 2.34 | 3.1 | 12.18 | 19.19 |
| Islamabad-Rwp. | 8.5 million | 12.04 | 11.35 | 21.86 | 90.7 | 271.92 | 1.42 | 1.34 | 2.57 | 10.67 | 31.99 |
| Peshawar | 7.5 million | 16.04 | 12.91 | 31.1 | 83.26 | 143.31 | 2.14 | 1.72 | 4.15 | 11.1 | 19.11 |
Exhibit 3.2: Comparison of Annual Emissions Across Pakistan’s Major Cities (2021). Karachi produces the highest absolute emissions, reflecting its industrial scale. Peshawar, however, shows the highest pollution burden per resident.
crucially notes that deaths from modern pollution sources like industrial emissions and ambient air pollution are increasing, having risen by 66% since 2000. In Pakistan, air pollution is estimated to cost the economy over 6.5% of its GDP annually.
Despite this growing crisis, Pakistan has historically lacked the data necessary for effective pollution management. While air quality monitoring data confirms the severity of air pollution, the lack of detailed, spatially resolved, and sectorally disaggregated emissions data has constrained the ability of policymakers, regulatory agencies, and stakeholders to formulate and implement targeted, efficient, and impactful mitigation strategies. This emissions inventory addresses this critical gap, creating the scientific foundation for a new chapter in the country’s air quality governance.3
This environmental challenge is amplified by climate change. As noted by WHO, “Air pollution and its health effects are exacerbated by climate change, which impacts levels and distribution of outdoor air pollutants such as ground-level ozone and particulate matter.” This creates a vicious cycle. Localised research, such as work on heat stress in Karachi by the Karachi Urban Lab, further highlights the compound risks faced by urban populations.
The scientific foundation for action
An emissions inventory is the definitive tool for diagnosing a pollution crisis. It is a systematic accounting of pollutants discharged into the atmosphere, allowing policymakers to identify precisely who pollutes the air, with what, and by how much. The methodology is based on a fundamental principle: Emissions = Activity Data × Emission Factor.
Activity Data (AD) answers: What is burning, and how much? It measures the scale of a polluting activity, such as fuel consumed by vehicles or coal burned in factories.
Emission Factor (EF) answers: How toxic is the activity? It is a coefficient that quantifies the amount of a pollutant released for every unit of that activity.
This study employed a systematic bottom-up methodology for the baseline year 2021, focusing on four criteria pollutants with the most significant health impacts: particulate matter (PM2.5), sulfur dioxide (SO2), nitrogen oxides (NOx), and carbon monoxide (CO).
Emission sectors
The sectoral distribution reveals distinctive patterns that should guide national policy priorities. We analysed seven major emissions sectors:
Transportation: This sector is the dominant source of pollution nationally, contributing 38% of urban PM2.5 and an overwhelming share of other key pollutants—nearly 84% of NOx and 87% of CO. Diesel vehicles, particularly trucks and buses, generate disproportionate particulate emissions despite representing a minority of the vehicle fleet.
Industry: Industrial activities contribute 32% of urban PM2.5 emissions, with particularly high contributions in Karachi (49%). Steel manufacturing, cement production, and textile processing emerge as especially significant industrial sources. This also includes emissions from on-site and ‘captive power’ generation used by industrial units.
Brick kilns: Despite their relatively small economic footprint, brick kilns contribute 10% of urban PM2.5 emissions nationally, with higher proportions in rapidly growing cities like Peshawar (19%) and Islamabad-Rawalpindi (18%).
Power generation: While power generation contributes minimally to PM2.5 (2%), it dominates SO2 emissions (33%) due to high-sulfur fuel use in many facilities, creating distinct environmental impacts.
Waste burning: Open waste burning contributes 7% of PM2.5 emissions nationally, with significant variations between cities reflecting different waste management practices and enforcement levels.
Residential: This sector includes emissions from household activities, primarily from fuel combustion for cooking and heating.
Commercial: This sector includes emissions from commercial buildings, markets, and backup power generators.
| Sector | Lahore | Karachi | Islamabad- Rawalpindi | Peshawar |
|---|---|---|---|---|
| Transport | 35% | 33% | 53% | 51% |
| Industry | 28% | 49% | 9% | 14% |
| Brick kilns | 17% | 0% | 18% | 18% |
| Waste | 6% | 7% | 11% | 7% |
| Other | 14% | 11% | 9% | 10% |
Exhibit 3.3: Relative Contribution of Sectors to PM2.5 Emissions (2021). This chart reveals the unique emissions fingerprint of each city, demanding tailored, not one-size-fits-all, solutions. Note the significant variation, with industry dominating in Karachi (49%) and transportation dominating in the twin cities (53%).
| Pollutant | Abbreviation | Averaging period | WHO AQG | Pakistan NEQS | NEQS is weaker by |
|---|---|---|---|---|---|
| Fine particulate matter | PM2.5 | 24-hour | 15 | 35 | 2.3x |
| Coarse particulate matter | PM10 | 24-hour | 45 | 150 | 3.3x |
| Sulfur dioxide | SO2 | 24-hour | 40 | 120 | 3.0x |
| Ozone | O3 | 8-hour (peak) | 100 | 130 | 1.3x |
| Carbon monoxide | CO | 8-hour | 5 | 10 | 2.0x |
Exhibit 3.4: The Governance Gap in Annual Air Quality Standards. This exhibit compares Pakistan’s annual NEQS for key pollutants against WHO’s health-based Air Quality Guideline (AQG) and its four interim targets. The NEQS for PM 2.5 only meets the third-strictest interim target, while its standard for PM10 fails to meet even the most lenient WHO target, while the standard for NO2 meets WHO’s Interim Target 2.
A tale of four cities: distinct, localised crises
This inventory’s most critical finding is that Pakistan’s air pollution is not a single, monolithic problem, but a series of distinct local emergencies. Each city’s economic DNA creates a unique emissions fingerprint, demanding a tailored response.
As Pakistan’s industrial and commercial capital, Karachi produces the highest absolute volume of emissions. Its pollution profile is a story of chronic industrial metabolism, where emissions from factories and two major ports create a constant health emergency. Unlike any other city, industry is the single largest source of PM2.5 (49%), making industrial policy central to any clean air solution. The path to clean air for Karachi must therefore run directly through its industrial zones and port corridors, focusing on technological upgrades, cleaner fuels, and stringent enforcement. With targeted interventions in industry (20-25% PM2.5 reduction potential) and transport (15-20% potential), significant progress is achievable.
In contrast, Lahore’s crisis is a story of a toxic, three-part blend, with near-equal contribution from transportation (35%), heavy industry like steel manufacturing (28%), and a dense ring of brick kilns (17%). This diversity of major sources makes it a uniquely complex challenge, requiring a multi-pronged strategy to tackle the severe, year-round pollution and the catastrophic winter smog episodes that define its air quality emergency. Solutions for Lahore must simultaneously address vehicle emissions, industrial smokestacks, and the thousands of surrounding kilns, with a combined PM2.5 reduction potential of over 45%.
Further north, Peshawar faces a challenge borne of its geography and economy. Trapped in a valley that contains pollution, its air is poisoned by heavy transit trade, traditional craft industries, and a significant brick kiln sector. This unique mix results in the highest perperson pollution burden in the country, at 2.14 kg of PM2.5 per resident annually. Cleaning Peshawar’s air will require a nuanced approach that modernises its role as a trade hub (20-25% PM2.5 reduction potential) while supporting its traditional economic sectors and transitioning its brick kilns to cleaner technologies (25-30% combined potential).
Finally, the Islamabad-Rawalpindi airshed serves as a stark warning. With minimal
| World Health Organization (WHO) | Pakistan | |||||
|---|---|---|---|---|---|---|
| Pollutant | AQG | IT-4 | IT-3 | IT-2 | IT-1 | NEQS |
| PM2.5 (μg/m3) | 5 | 10 | 15 | 25 | 35 | 15 |
| PM10 (μg/m3) | 15 | 20 | 30 | 50 | 70 | 120 |
| NO2 (μg/m3) | 10 | 20 | 30 | 40 | N/A | 40 |
Exhibit 3.5: The Governance Gap in Short-Term Air Quality Standards. This exhibit shows that for daily pollution spikes, Pakistan’s standards permit citizens to be exposed to pollutant concentrations far above levels considered safe by WHO, leaving the public vulnerable to acute health impacts.
industrial sources, the capital region is choked overwhelmingly by its transport sector (53% of PM2.5). It proves that car-centric urban planning and a failure to invest in mass transit are, on their own, enough to create a severe public health emergency. The solution pathway for the twin cities is less about industrial regulation and more about a fundamental reimagining of urban mobility and development, where expanding public transport and managing construction and waste could reduce PM2.5 by over 40%.
The governance gap in air quality standards
The technical sources of air pollution are enabled and exacerbated by deep-rooted systemic issues. A persistent and costly gap exists between inefficient local practices and modern international standards in industry and transport. This is compounded by the dominance of high-sulfur fuels, particularly diesel, which renders modern vehicle emission controls ineffective and significantly increases pollution.
Underpinning these issues is a chronic failure of regulatory enforcement, which allows high-emitting activities to continue with impunity. This enforcement gap is made worse by a historically inadequate air quality monitoring network that has prevented both accurate diagnosis and the evaluation of policy effectiveness.
A final, critical failure lies in the standards themselves. Pakistan’s National Environmental Quality Standards (NEQS) for ambient air are dangerously out of step with global health science.4 WHO provides a series of Interim Targets as a roadmap for heavily polluted regions to make incremental progress.5 As the following exhibits show, Pakistan’s legal standards often fail to meet even the most lenient of these interim targets, creating a fundamental chasm in public protection.
This policy gap results in a state of near-constant hazard, as revealed by real-time monitoring data.
| Airshed | Good Days (within WHO Guidelines) | Unhealthy Days (within NEQS limits) | Hazardous Days (exceeding NEQS limits) |
|---|---|---|---|
| Lahore | 0 | 148 | 218 |
| Peshawar | 0 | 140 | 226 |
| Karachi | 3 | 213 | 150 |
| Islamabad | 36 | 215 | 115 |
| Rawalpindi | 9 | 140 | 217 |
Exhibit 3.6: The Scarcity of Clean Air in Pakistan’s Cities (2024). This chart illustrates the daily reality of Pakistan’s air quality crisis. For residents of Lahore and Peshawar, not a single day in 2024 met the global standard for clean air, revealing a near-constant state of exposure to toxic pollution. The data highlights the “policy gap” where days classified as “unhealthy” by global health standards are still considered legal under Pakistan’s weaker National Environmental Quality Standards (NEQS).
Beyond the urban areas
While this inventory focuses on urban airsheds, a complete picture of Pakistan’s air quality crisis must acknowledge major contributing sources that are under-researched and often unregulated.
Crop-residue burning
The seasonal burning of crop residue is a major contributor to the dense winter smog that blankets Punjab. A 2020 report by FAO, R-SMOG, estimated that crop burning is responsible for 25% of air pollutant emissions in Punjab (Pakistan) during peak season.1 As confirmed by NASA, every November, satellites detect large numbers of smoke plumes as farmers in the Punjab region use fire as a fast, inexpensive way to clear fields after the rice harvest. The influx of smoke, combined with meteorological conditions like temperature inversions that trap pollution, leads to a sharp deterioration of air quality.
This phenomenon was particularly severe in 2024. On November 3, satellite imagery captured a thick blanket of smoke streaming from thousands of small fires across the region. Air quality sensors in Lahore recorded hazardous PM2.5 levels on multiple days, prompting school closures and partial lockdowns. However, as NASA scientists explain, smoke from crop fires is not the only contributor to the haze. A toxic mix of urban emissions, from vehicles, industry, and waste burning, combines with the agricultural smoke and is trapped between the Himalayas and the Vindhya Range, creating the catastrophic smog episodes. Based on satellite data, NASA scientists projected that between 15,500 and 18,500 fires would be detected in the region in 2024, a higher number than in most recent years. The lack of effective rural air quality monitoring remains a critical knowledge gap, hindering the development of policies that promote sustainable agricultural practices and provide farmers with viable alternatives to burning.
Household air pollution
Household air pollution is another understudied crisis in Pakistan. The majority of households, particularly in rural and low-income urban areas, lack access to clean cooking fuels. Limited natural gas connections and the unaffordability of LPG force millions to rely on the indoor burning of biomass, such as wood, animal dung, and crop waste, for cooking and heating. This practice releases a toxic mix of particulate matter and other pollutants directly into the living space, leading to severe health impacts, particularly for women and children who are most exposed.7 A recent study in The Lancet highlighted that by curbing solid biofuel combustion, Pakistan could achieve a 13–21% greater reduction in health costs compared to relative improvements in air quality from other sources, underscoring the immense public health return on investment from addressing this sector.8
Open burning of waste
Across Pakistan’s cities, a significant portion of municipal solid waste is not collected or managed safely. This leads to the widespread practice of open waste burning, both at large dump sites and on neighbourhood street corners. This uncontrolled combustion releases a hazardous cocktail of pollutants, including dioxins, furans, and black carbon. Effective solutions require a systemic transformation in waste management, applying the principles of reduce, reuse, and recycle. This includes empowering the informal sector of waste pickers, ensuring effective and consistent waste removal, and investing in modern, sanitary landfill management to prevent fires and environmental contamination.
A path forward
This inventory challenges the narrative that air pollution is an intractable issue or driven primarily by forces beyond Pakistan’s control. It proves that the sources are local, measurable, and—most importantly—actionable. The science is now established, the primary sources are identified, and the technological solutions are well-understood. With this evidence as a foundation, a future with cleaner, healthier air for all Pakistanis is within reach, requiring only the political will to transform this science into clean, breathable air for Pakistan.
A note on methodology and data
This report uses the 2021 calendar year as the baseline for the emissions inventory, representing the most recent year with complete, verifiable activity data across all sectors at the time of analysis.
The analysis of daily air quality compliance (number of clean vs. hazardous days) uses realtime monitoring data from the PAQI network for the 2024 calendar year to reflect the most current state of public exposure.